The Error Bars Chart Type
Error Bars can be added to a SciChart.js chart using the FastErrorBarsRenderableSeries📘 type.
The JavaScript Error Bars Chart Example can be found in the SciChart.Js Examples Suite > Error Bars Chart on Github, or our live demo at scichart.com/demo.
Creating Error Bars Series
To create a Javascript Error Bars Chart with SciChart.js, use the following code:
- TS
- Builder API (JSON Config)
    // Demonstrates how to create a chart with error bars using SciChart.js
    const {
        SciChartSurface,
        NumericAxis,
        FastErrorBarsRenderableSeries,
        HlcDataSeries,
        EErrorMode,
        EErrorDirection,
        EDataPointWidthMode,
        SciChartJsNavyTheme
    } = SciChart;
    // or, for npm, import { SciChartSurface, ... } from "scichart"

    const { wasmContext, sciChartSurface } = await SciChartSurface.create(divElementId, {
        theme: new SciChartJsNavyTheme()
    });

    // Add X and Y axes to the chart
    sciChartSurface.xAxes.add(new NumericAxis(wasmContext));
    sciChartSurface.yAxes.add(new NumericAxis(wasmContext));

    // Create a FastErrorBarsRenderableSeries with HLC data
    const errorBarsSeries = new FastErrorBarsRenderableSeries(wasmContext, {
        dataSeries: new HlcDataSeries(wasmContext, {
            xValues: [0, 1, 2, 3, 4, 5, 6, 7, 8],
            yValues: [2.5, 3.5, 3.7, 4.0, 5.0, 5.5, 5.0, 4.0, 3.0], // "Mid" points (pointMarkers are placed here)
            highValues: [3.7, 3.8, 4.0, 5.3, 5.9, 5.7, 5.0, 4.3, 3.2], // highest point of the error bars
            lowValues: [2.2, 3.4, 3.3, 3.8, 5.0, 4.8, 3.5, 3.0, 1.8] // lowest point of the error bars
        }),
        stroke: "#50C7E0",
        strokeThickness: 2,

        // Optional parameters. Defaults are Both, Vertical
        errorMode: EErrorMode.Both,
        errorDirection: EErrorDirection.Vertical,

        // More optional parameters. Defaults are 0.5, Relative
        dataPointWidth: 0.5,
        dataPointWidthMode: EDataPointWidthMode.Relative
    });
    sciChartSurface.renderableSeries.add(errorBarsSeries);
    // Demonstrates how to create a chart with error bars in SciChart.js using the Builder API
    const {
        build2DChart,
        ESeriesType,
        EThemeProviderType,
        EErrorMode,
        EErrorDirection,
        EDataPointWidthMode
    } = SciChart;

    const { wasmContext, sciChartSurface } = await build2DChart(divElementId, {
        surface: { theme: { type: EThemeProviderType.Dark } },
        series: [
            {
                type: ESeriesType.ErrorBarsSeries,
                hlcData: {
                    xValues: [0, 1, 2, 3, 4, 5, 6, 7, 8],
                    yValues: [2.5, 3.5, 3.7, 4.0, 5.0, 5.5, 5.0, 4.0, 3.0],
                    highValues: [3.7, 3.8, 4.0, 5.3, 5.9, 5.7, 5.0, 4.3, 3.2],
                    lowValues: [2.2, 3.4, 3.3, 3.8, 5.0, 4.8, 3.5, 3.0, 1.8]
                },
                options: {
                    stroke: "#50C7E0",
                    strokeThickness: 3,
                    errorMode: EErrorMode.Both,
                    errorDirection: EErrorDirection.Vertical,
                    dataPointWidth: 0.5,
                    dataPointWidthMode: EDataPointWidthMode.Relative
                }
            }
        ]
    });
This results in the following:
In the code above:
- We define HlcDataSeries📘, passing arrays with X, Y, High, and Low values
- A FastErrorBarsRenderableSeries📘 is created with dataSeries option and added to the SciChartSurface.renderableSeries📘 collection.
- Alternatively we can assign a FastErrorBarsRenderableSeries.dataSeries📘 property, which stores the HLC data to render.
Error Mode
FastErrorBarsRenderableSeries.errorMode📘 property defines whether high and low caps should be displayed on error bars. Available values are defined by enum EErrorMode📘. We can set this property either via the series itself, or passing in to constructor options (see type IFastErrorBarsRenderableSeriesOptions📘).
The following example shows how to use only high error on bars.
const errorBarsSeries = new FastErrorBarsRenderableSeries(wasmContext, {
    dataSeries: hlcDataSeries,
    errorMode: EErrorMode.High,
});
This results in the following output:
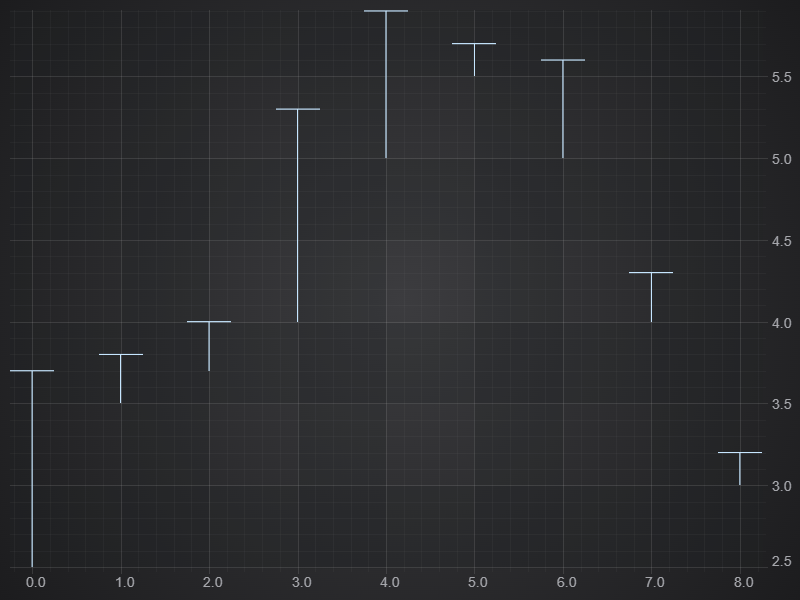
Error Bars Series with High Error Segments Only
Horizontal Error Bars
It is possible to change the direction of Error Bars to horizontal using FastErrorBarsRenderableSeries.errorDirection📘 property. In this case the High & Low values in HlcDataSeries📘 are applied in the X-direction.
import { EErrorDirection } from "scichart";
// ...

const horizontalBars = new FastErrorBarsRenderableSeries(wasmContext, {
    dataSeries: new HlcDataSeries(wasmContext, {
        xValues: [0, 1, 2, 2.5, 4.5, 5, 6, 7, 8],
        yValues: [2.5, 3.5, 3.7, 4.0, 5.0, 5.5, 5.0, 4.0, 3.0],
        // High, Low becomes left-right as absolute values
        highValues: [-0.5, 0.6, 1.1, 2.3, 4.0, 4.9, 5.8, 6.8, 7.5],
        lowValues: [0.4, 1.2, 2.1, 3.0, 4.7, 5.7, 6.5, 7.3, 8.9],
    }),
    errorDirection: EErrorDirection.Horizontal,
});
This results in the following output
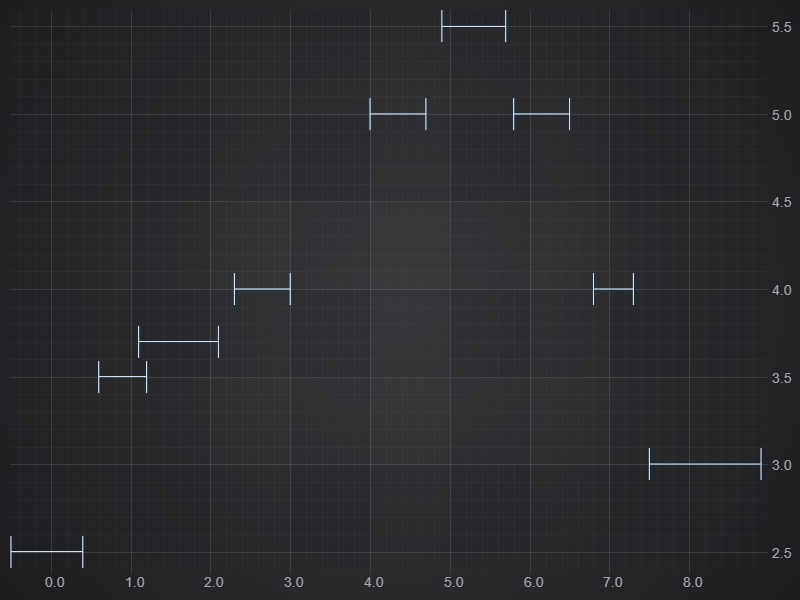
Horizontal ErrorBars
Advanced Properties
Setting Stroke, StrokeThickness and StrokeDash
Error Bars in SciChart.js support setting stroke📘, strokeThickness📘 and strokeDashArray📘 to set a dashed line style.
For example, this code:
const errorBarsSeries = new FastErrorBarsRenderableSeries(wasmContext, {
    dataSeries: hlcDataSeries,
    stroke: "Aqua",
    strokeDashArray: [4, 2],
    strokeThickness: 4,
});
Results in this:
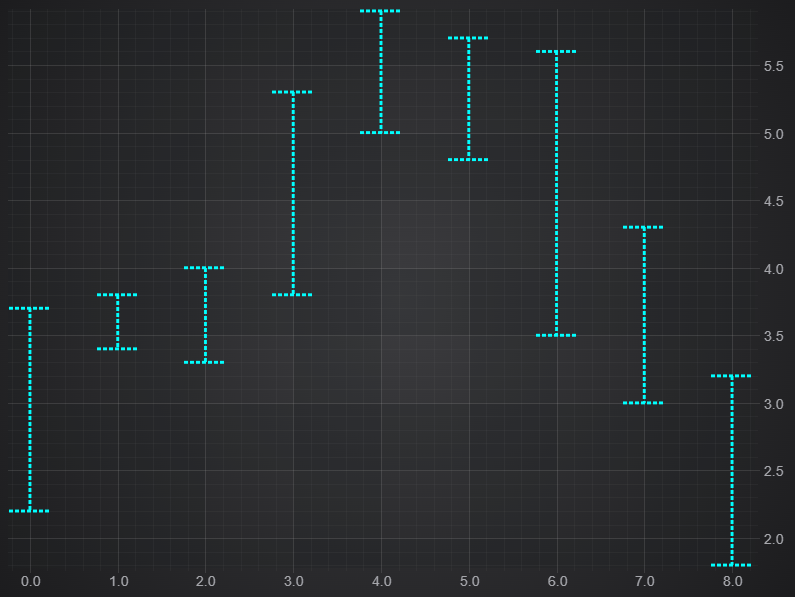
Advanced properties on Error Bars - stroke, strokeThickness, strokeDashArray
Learn more about Dashed Line Styling at this documentation page.
Drawing a Line and PointMarker through Error Bars
You can add a PointMarker to highlight the Y-value of an HlcDataSeries📘. The data can also be used twice to display both lines / scatter points and error bars.
Try this code out:
import { FastLineRenderableSeries, FastErrorBarsRenderableSeries, HlcDataSeries, EllipsePointMarker  } from "scichart";

// Many RenderableSeries can share one DataSeries in SciChart

// Use the HlcDataSeries on a FastLineRenderableSeries
const lineSeries = new FastLineRenderableSeries(wasmContext, {
    dataSeries: hlcDataSeries, // will render XY values, and ignore high/low values
    stroke: "SteelBlue"
});

// Use the same HlcDataSeries on a FastErrorBarsRenderableSeries. It will render high/lows for error bars
const errorBarsSeries = new FastErrorBarsRenderableSeries(wasmContext, {
    dataSeries: hlcDataSeries,
    stroke: "SteelBlue",
    strokeThickness: 3,
    opacity: 0.77,
    pointMarker: new EllipsePointMarker(wasmContext, {
        width: 10,
        height: 10,
        fill: "SteelBlue",
        stroke: "#333"
    })
});

sciChartSurface.renderableSeries.add(lineSeries);
sciChartSurface.renderableSeries.add(errorBarsSeries);
This results in the folllowing output:
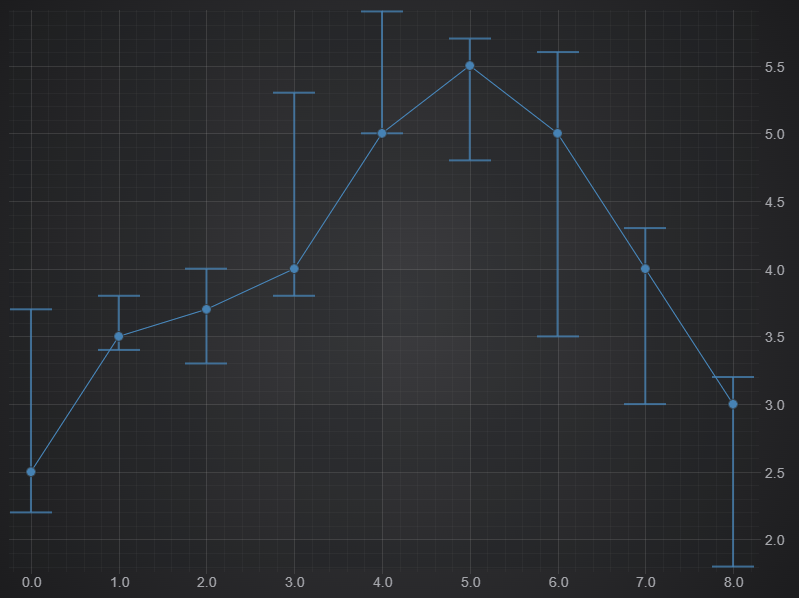
Drawing a Line and PointMarkers through Error Bars
Setting the Width of Error Bars Whiskers
You can define the width of Error Bars using dataPointWidth📘 and dataPointWidthMode📘 which supports values from EDataPointMode📘.
For example. setting dataPointWidthMode to Absolute and dataPointWidth to 50 ensures 50 pixels always.
const errorBarsSeries = new FastErrorBarsRenderableSeries(wasmContext, {
    dataSeries: hlcDataSeries,
    stroke: "LightSteelBlue",
    strokeThickness: 3,
    dataPointWidth: 50,
    dataPointWidthMode: EDataPointWidthMode.Absolute,
});
sciChartSurface.renderableSeries.add(errorBarsSeries);
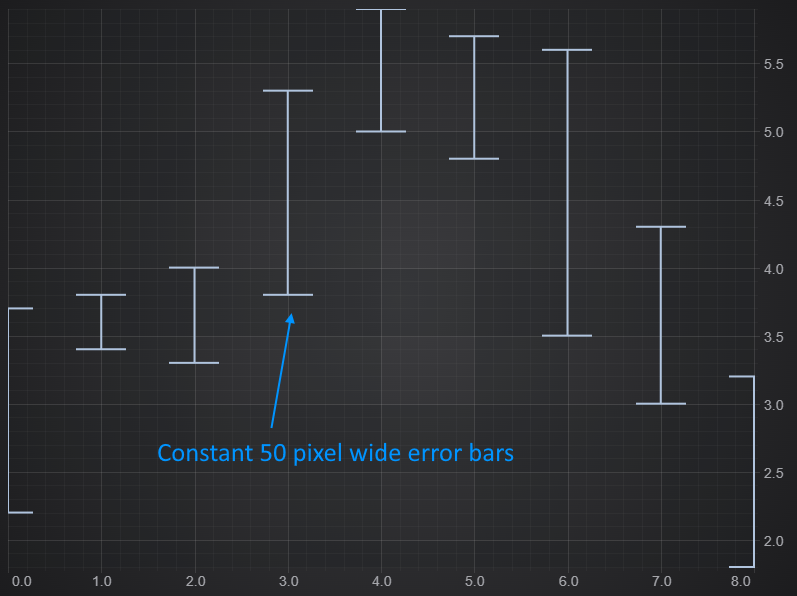
Setting the Width of Error Bars Whiskers
The alternative mode is EDataPointWidthMode.Relative📘.
In this mode a dataPointWidth value of 0.0 - 1.0 occupies 0% to 100% of the available space as calculated by SciChart.js.
const errorBarsSeries = new FastErrorBarsRenderableSeries(wasmContext, {
    dataSeries: hlcDataSeries,
    stroke: "LightSteelBlue",
    strokeThickness: 3,
    dataPointWidth: 0.2,
    dataPointWidthMode: EDataPointWidthMode.Relative,
});
sciChartSurface.renderableSeries.add(errorBarsSeries);
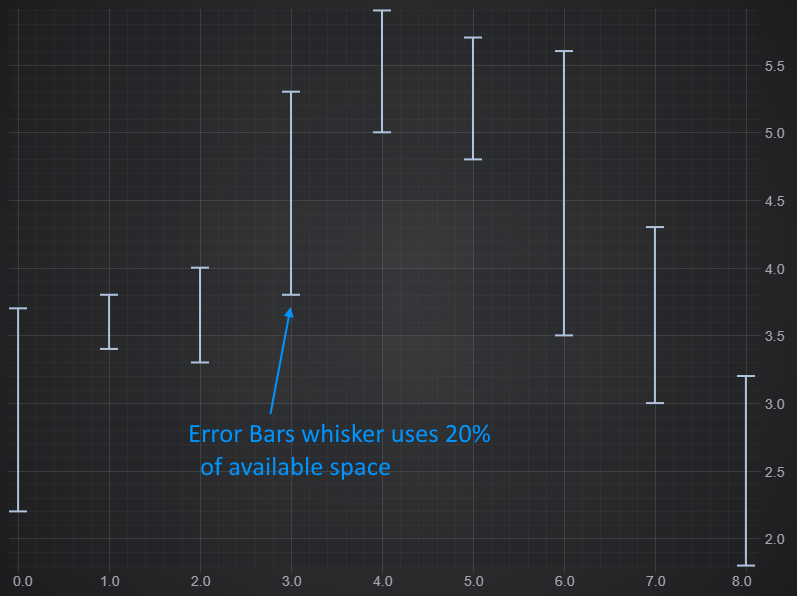
The Relative Width of Error Bars Whiskers
Showing/Hiding Error Bars Connector or Whiskers
You can specify which parts of an Error Bar should be visible using drawConnector📘 and drawWhiskers📘 and finally;
const errorBarsSeries = new FastErrorBarsRenderableSeries(wasmContext, {
    dataSeries: hlcDataSeries,
    stroke: "LightSteelBlue",
    strokeThickness: 3,
    drawConnector: false, // Draw the horizontal connector
    drawWhiskers: true,   // Draw the top/bottom whiskers
});
sciChartSurface.renderableSeries.add(errorBarsSeries);
Results in this:
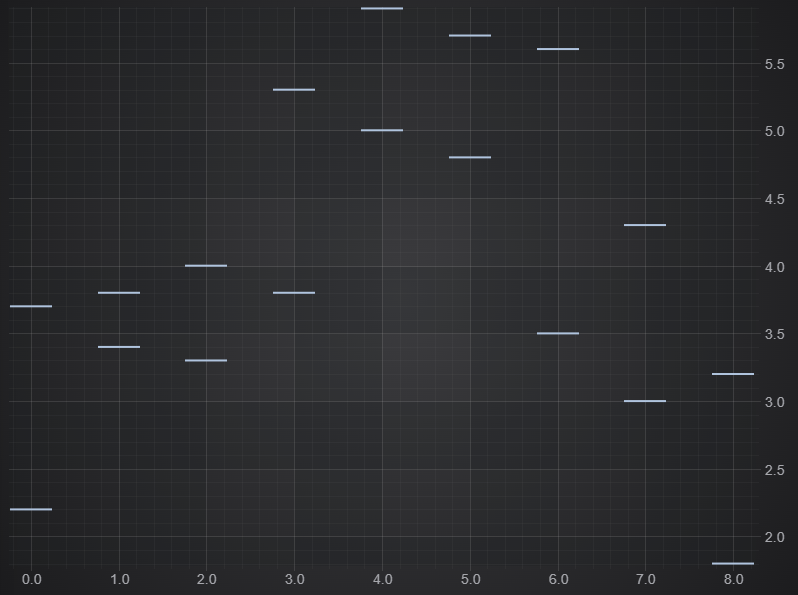
Hiding Parts of Error Bars - Connector / Whiskers