
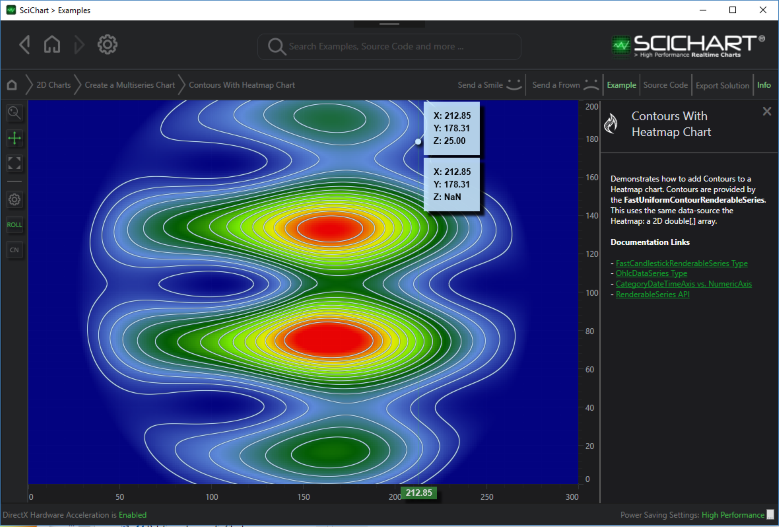
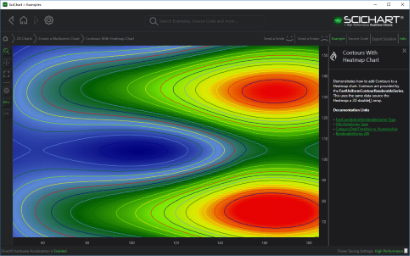
SciChart WPF v5 provides a series type to draw contours on Uniform Data called the FastUniformContourRenderableSeries, the same type of data used by the FastUniformHeatmapRenderableSeries.
Examples for the Contours Series Chart can be found in the SciChart WPF Examples Suite which can be downloaded from the SciChart Website or our SciChart.WPF.Examples Github Repository.
Declaring a Contours Series in Xaml / Code Behind
| Declaring a FastUniformContourRenderableSeries |
Copy Code |
|---|---|
<s:SciChartSurface x:Name="sciChart" Padding="0" BorderThickness="0"> <s:SciChartSurface.RenderableSeries> <!-- (OPTIONAL) Declare a heatmap, over this we will add the contours --> <s:FastUniformHeatmapRenderableSeries x:Name="heatmapSeries" Opacity="0.9"> <s:FastUniformHeatmapRenderableSeries.ColorMap> <s:HeatmapColorPalette Maximum="1"> <s:HeatmapColorPalette.GradientStops> <GradientStop Offset="0" Color="DarkBlue" /> <GradientStop Offset="0.2" Color="CornflowerBlue" /> <GradientStop Offset="0.4" Color="DarkGreen" /> <GradientStop Offset="0.6" Color="Chartreuse" /> <GradientStop Offset="0.8" Color="Yellow" /> <GradientStop Offset="1" Color="Red" /> </s:HeatmapColorPalette.GradientStops> </s:HeatmapColorPalette> </s:FastUniformHeatmapRenderableSeries.ColorMap> </s:FastUniformHeatmapRenderableSeries> <!-- Declare the contour series --> <s:FastUniformContourRenderableSeries x:Name="contourSeries" AntiAliasing="True"/> </s:SciChartSurface.RenderableSeries> <s:SciChartSurface.XAxis> <s:NumericAxis DrawMajorBands="True" /> </s:SciChartSurface.XAxis> <s:SciChartSurface.YAxis> <s:NumericAxis DrawMajorBands="True" /> </s:SciChartSurface.YAxis> </s:SciChartSurface> // Then, in code-behind, apply the data void InitializeHeatmapAndContourData() { var colormap = heatmapSeries.ColorMap; var cpMin = colormap.Minimum; var cpMax = colormap.Maximum; // Create a UniformHeatmapDataSeries var uniformDataSeries = CreateSeries(3, 300, 200, cpMin, cpMax); // Apply the DataSeries to the heatmap & contour heatmapSeries.DataSeries = uniformDataSeries; contourSeries.DataSeries = uniformDataSeries; } private IDataSeries CreateSeries(int index, int width, int height, double cpMin, double cpMax) { double angle = Math.PI * 2 * index / seriesPerPeriod; int w = width, h = height; var data = new double[h, w]; for (int x = 0; x < w; x++) for (int y = 0; y < h; y++) { var v = (1 + Math.Sin(x * 0.04 + angle)) * 50 + (1 + Math.Sin(y * 0.1 + angle)) * 50 * (1 + Math.Sin(angle * 2)); var cx = w / 2; var cy = h / 2; var r = Math.Sqrt((x - cx) * (x - cx) + (y - cy) * (y - cy)); var exp = Math.Max(0, 1 - r * 0.008); var zValue = (v * exp ); data[y, x] = (zValue > cpMax) ? cpMax : zValue; } return new UniformHeatmapDataSeries<int, int, double>(data, 0, 1, 0, 1); } | |
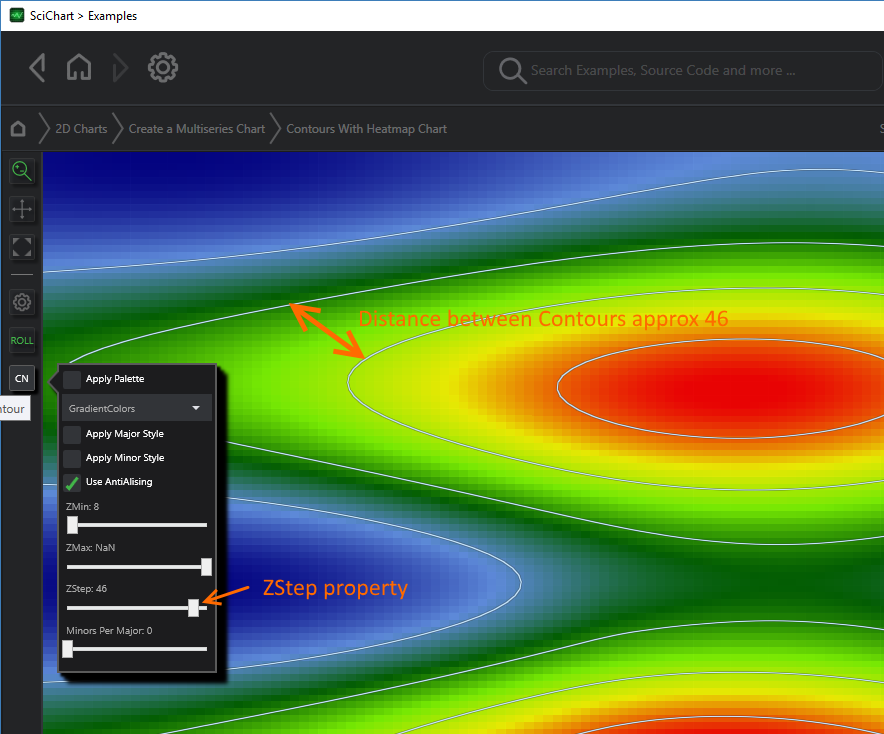
Defining the Spacing of Contour Lines
There are two types of contour lines: Major and minor. ZStep defines positions of MajorLines based on the data passed to the contour series. There is a property MinorsPerMajor which defines the number of Minor contour lines between major lines. ZMin and ZMax also define the start and stop position of contours.
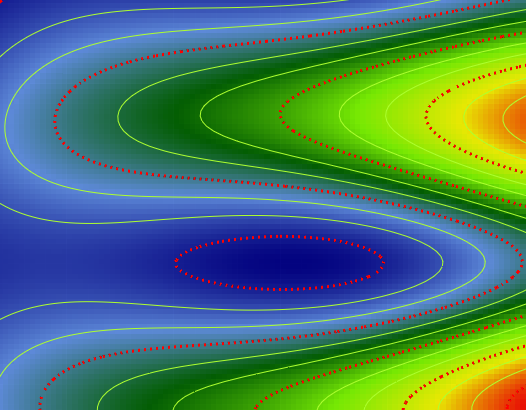
Applying Styles to the Contour Lines
Major and Minor Contour Lines can be applied via the MajorLineStyle, MinorLineStyle properties.
These properties accept a Style with TargetType Line so you can set the StrokeThickness, Stroke, StrokeDashArray of the contour line.
e.g. the following code:
| Applying Contour Line Styles |
Copy Code |
|---|---|
<s:SciChartSurface> <s:SciChartSurface.Resources> <Style x:Key="MajorContourLineStyle" TargetType="s:ContourLine"> <Setter Property="StrokeDashArray" Value="2,4" /> <Setter Property="StrokeThickness" Value="3" /> <Setter Property="Stroke" Value="Red" /> </Style> <Style x:Key="MinorContourLineStyle" TargetType="s:ContourLine"> <Setter Property="StrokeThickness" Value="1" /> <Setter Property="Stroke" Value="GreenYellow" /> </Style> </s:SciChartSurface.Resources> <s:SciChartSurface.RenderableSeries> <s:FastUniformContourRenderableSeries x:Name="contourSeries" AntiAliasing="True" MajorLineStyle="{StaticResource MajorContourLineStyle}" MinorLineStyle="{StaticResource MinorContourLineStyle}"/> </s:SciChartSurface.RenderableSeries> <!-- XAxis, YAxis omitted for brevity --> </s:SciChartSurface> | |
Resuts in the following output:
Applying Palettes to the Contour Lines
Conversion of data value into color is defined by the property FastUniformContourRenderableSeries.ColorMap. The ColorMap is type HeatmapColorPalette.
ColorMaps are optional. When a ColorMap is not set, then the FastUniformContourRenderableSeries simply obeys the BaseRenderableSeries.Stroke property.
You can define a custom Color Palette in XAML as follows:
| Converting DataValues to Colors (Defining a Color Map) |
Copy Code |
|---|---|
<s:FastUniformContourRenderableSeries x:Name="contourSeries"> <s:FastUniformContourRenderableSeries.ColorMap> <s:HeatmapColorPalette Minimum="0" Maximum="100"> <GradientStop Color="Blue" Offset="0"/> <GradientStop Color="White" Offset="0.3"/> <GradientStop Color="Green" Offset="0.5"/> <GradientStop Color="Yellow" Offset="0.7"/> <GradientStop Color="Red" Offset="1"/> </s:HeatmapColorPalette> </s:FastUniformContourRenderableSeries.ColorMap> </s:FastUniformContourRenderableSeries> | |
When the ColorMap is applied, and no MajorLineStyle / MinorLineStyle is applied, there are two modes of applying the color map to the Contours Series.
ColorPaletteMode.GradientColors
In this mode when FastUniformContourRenderableSeries.ColorMapMode = GradientColors, the ColorMap is applied to the contours in a very similar way to the heatmap series. The HeatmapColorMap.Minimum, Maximum properties are used to map the data to gradient colors, e.g. The Gradient Stop with Offset = 0 corresponds to HeatmapColorPalette.Minimum data value, offset=1 corresponds to HeatmapColorPalette.Maximum data value. By default Minimum = 0, Maximum = 1.
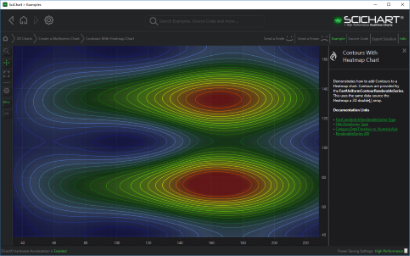
Gradient Colors contours
ColorPaletteMode.AlternateColors
In this mode when FastUniformContourRenderableSeries.ColorMapMode = AlternateColors, the ColorMap is applied to the contours series very simply - the gradient offsets are ignored
Alternate Colors contours
Troubleshooting
When using the contours series with DrawingMode.Fast, a fast, GPU based algorithm is used to calcualte contours. Unfortunately this algorithm can have some artifacts depending on your data & the properties set on the contour series.
if you end up with a chart that looks like this:
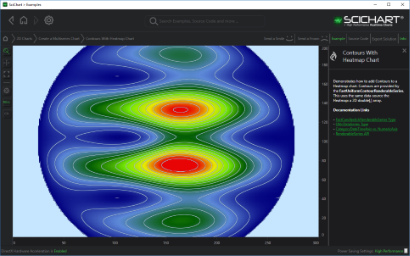
Bugs in the Contour Series when DrawingMode = Fast
You can usually make this solid fill area go away by adjusting the ZMin, or ZStep property slightly. Try values of ZMin that do not equal zero to ensure that the contour does not fall on a large block of the heatmap data of the same value.
Alternatively, if you require accurate contours under all conditions, you can set DrawingMode.Accurate. This will fall back to a much more accurate, software-based algorithm for calculating contours.