SciChart® the market leader in Fast WPF Charts, WPF 3D Charts, iOS Chart, Android Chart and JavaScript Chart Components
SciChart WPF ships with hundreds of WPF Chart Examples which you can browse, play with, view the source-code and even export each WPF Chart Example to a stand-alone Visual Studio solution. All of this is possible with the new and improved SciChart WPF Examples Suite, which ships as part of the SciChart WPF SDK.
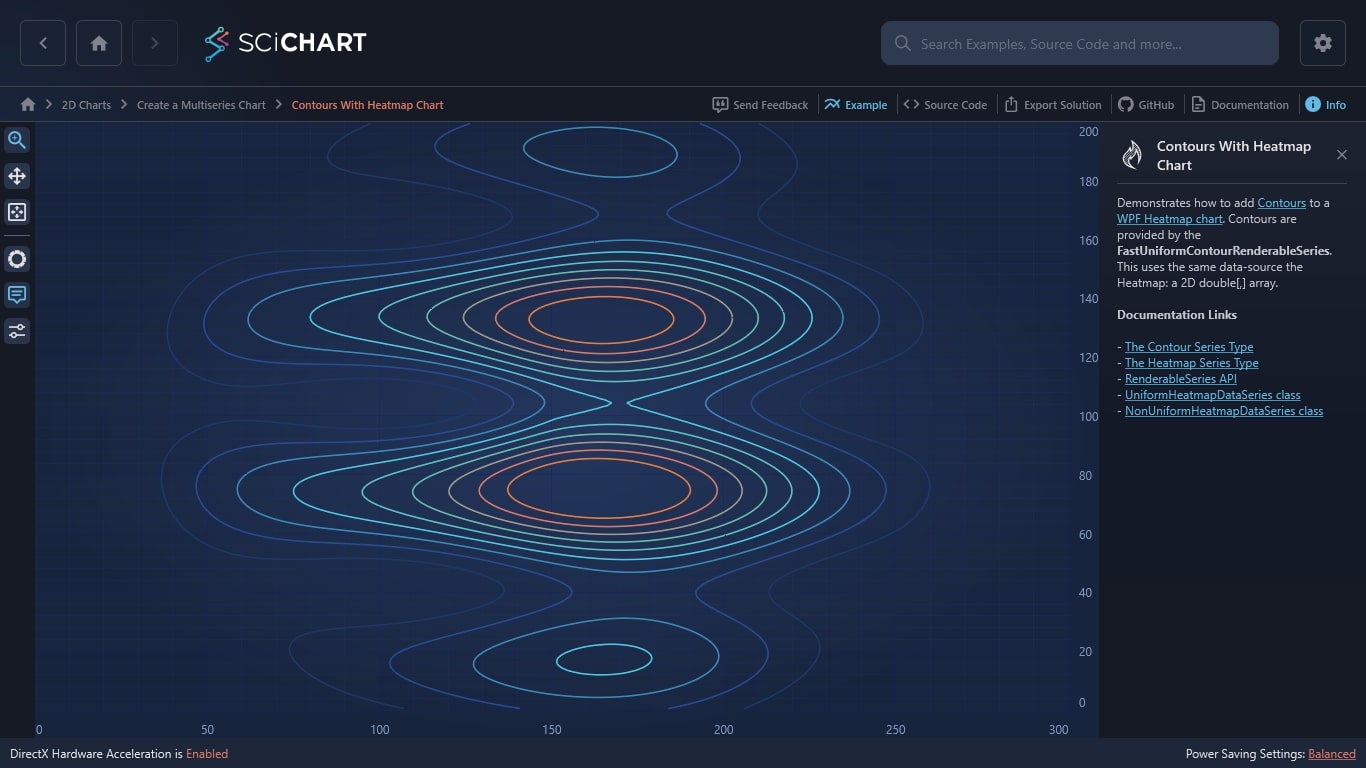
Demonstrates how to add Contours to a WPF Heatmap chart. Contours are provided by the FastUniformContourRenderableSeries. This uses the same data-source the Heatmap: a 2D double[,] array.
Documentation Links
– The Contour Series Type
– The Heatmap Series Type
– RenderableSeries API
– UniformHeatmapDataSeries class
– NonUniformHeatmapDataSeries class
The C#/WPF source code for the WPF Contours With Heatmap Chart example is included below (Scroll down!).
Did you know you can also view the source code from one of the following sources as well?
<UserControl x:Class="SciChart.Examples.Examples.HeatmapChartTypes.RealTimeHeatmap.ContoursExampleView"
xmlns="http://schemas.microsoft.com/winfx/2006/xaml/presentation"
xmlns:x="http://schemas.microsoft.com/winfx/2006/xaml"
xmlns:s="http://schemas.abtsoftware.co.uk/scichart"
xmlns:mc="http://schemas.openxmlformats.org/markup-compatibility/2006"
xmlns:d="http://schemas.microsoft.com/expression/blend/2008"
xmlns:ext="http://schemas.abtsoftware.co.uk/scichart/exampleExternals"
xmlns:system="clr-namespace:System;assembly=mscorlib"
d:DesignHeight="400"
d:DesignWidth="600"
mc:Ignorable="d">
<UserControl.Resources>
<s:GradientStopsToLinearGradientBrushConverter x:Key="ColorsToLinearGradientBrushConverter"/>
<ObjectDataProvider x:Key="PaletteModesProvider"
MethodName="GetValues"
ObjectType="{x:Type system:Enum}">
<ObjectDataProvider.MethodParameters>
<x:Type TypeName="s:ColorPaletteMode" />
</ObjectDataProvider.MethodParameters>
</ObjectDataProvider>
<Style x:Key="MajorContourLineStyle" TargetType="s:ContourLine">
<Setter Property="StrokeDashArray" Value="2,4" />
<Setter Property="StrokeThickness" Value="3" />
<Setter Property="Stroke" Value="Red" />
</Style>
<Style x:Key="MinorContourLineStyle" TargetType="s:ContourLine">
<Setter Property="StrokeThickness" Value="1" />
<Setter Property="Stroke" Value="GreenYellow" />
</Style>
<s:HeatmapColorPalette x:Key="ColorPalette" Maximum="200">
<s:HeatmapColorPalette.GradientStops>
<GradientStop Offset="0.0" Color="DarkBlue" />
<GradientStop Offset="0.2" Color="CornflowerBlue" />
<GradientStop Offset="0.4" Color="DarkGreen" />
<GradientStop Offset="0.6" Color="Chartreuse" />
<GradientStop Offset="0.8" Color="Yellow" />
<GradientStop Offset="1.0" Color="Red" />
</s:HeatmapColorPalette.GradientStops>
</s:HeatmapColorPalette>
<Style TargetType="TextBox">
<Setter Property="MinWidth" Value="50"/>
<Setter Property="Height" Value="16"/>
<Setter Property="VerticalContentAlignment" Value="Center"/>
</Style>
<Style TargetType="Label">
<Setter Property="Foreground" Value="White"/>
</Style>
</UserControl.Resources>
<Grid>
<Grid.ColumnDefinitions>
<ColumnDefinition Width="Auto" />
<ColumnDefinition Width="*" />
</Grid.ColumnDefinitions>
<!-- The SciChartInteractionToolbar adds zoom, pan, zoom extents and rotate functionality -->
<!-- to the chart and is included for example purposes. -->
<!-- If you wish to know how to zoom and pan a chart then do a search for Zoom Pan in the Examples suite! -->
<ext:SciChartInteractionToolbar TargetSurface="{Binding Source={x:Reference Name=sciChart}}">
<ext:FlyoutMenuButton x:Name="ContourOptions"
HorizontalAlignment="Left"
FontSize="10"
Content="CN"
ToolTipService.ToolTip="Contour">
<ext:FlyoutMenuButton.PopupContent>
<StackPanel MinWidth="150" MinHeight="300" Orientation="Vertical">
<CheckBox x:Name="ApplyPaletteCkb"
Content="Apply Palette"
Click="OnApplyPalette"
Margin="0,2"/>
<ComboBox x:Name="ContourPaletteMode"
MinWidth="10"
ItemsSource="{Binding Source={StaticResource PaletteModesProvider}}"
SelectedItem="{Binding Source={x:Reference contourSeries}, Path=ColorMapMode}"
SelectedIndex="1"
Margin="0,2"/>
<CheckBox x:Name="ApplyMajorStyleCkb"
Content="Apply Major Style"
Click="OnApplyMajorStyle"
Margin="0,2"/>
<CheckBox x:Name="ApplyMinorStyleCkb"
Content="Apply Minor Style"
Click="OnApplyMinorStyle"
Margin="0,2"/>
<CheckBox Content="Use AntiAliasing"
IsChecked="{Binding Source={x:Reference contourSeries}, Path=AntiAliasing}"
Margin="0,2" />
<CheckBox Content="Show Heatmap"
IsChecked="{Binding Source={x:Reference heatmapSeries}, Path=IsVisible}"
Margin="0,2"/>
<TextBlock Text="{Binding Source={x:Reference contourSeries}, Path=ZMin, Mode=OneWay, StringFormat='{}ZMin: {0:0}'}" />
<Slider Minimum="5"
Maximum="200"
Interval="1"
Value="{Binding Source={x:Reference contourSeries}, Path=ZMin, FallbackValue=10}"/>
<TextBlock Text="{Binding Source={x:Reference contourSeries}, Path=ZMax, Mode=OneWay, StringFormat='{}ZMax: {0:0}'}" />
<Slider Minimum="5"
Maximum="200"
Interval="1"
Value="{Binding Source={x:Reference contourSeries}, Path=ZMax, FallbackValue=200}"/>
<TextBlock Text="{Binding Source={x:Reference contourSeries}, Path=ZStep, Mode=OneWay, StringFormat='{}ZStep: {0:0}'}" />
<Slider Minimum="5"
Maximum="50"
Interval="5"
Value="{Binding Source={x:Reference contourSeries}, Path=ZStep, FallbackValue=20}" />
<TextBlock Text="{Binding Source={x:Reference contourSeries}, Path=MinorsPerMajor, Mode=OneWay, StringFormat='{}Minors Per Major: {0:0}'}" />
<Slider Minimum="0"
Maximum="10"
Interval="1"
Value="{Binding Source={x:Reference contourSeries}, Path=MinorsPerMajor}"/>
</StackPanel>
</ext:FlyoutMenuButton.PopupContent>
</ext:FlyoutMenuButton>
</ext:SciChartInteractionToolbar>
<s:SciChartSurface x:Name="sciChart" Grid.Column="1">
<s:SciChartSurface.RenderableSeries>
<s:FastUniformContourRenderableSeries x:Name="contourSeries"
AntiAliasing="True"
ZMax="200"
ZMin="20"
ZStep="20"/>
<s:FastUniformHeatmapRenderableSeries x:Name="heatmapSeries" Opacity="0.9">
<s:FastUniformHeatmapRenderableSeries.ColorMap>
<s:HeatmapColorPalette Maximum="200">
<s:HeatmapColorPalette.GradientStops>
<GradientStop Offset="0.0" Color="DarkBlue" />
<GradientStop Offset="0.2" Color="CornflowerBlue" />
<GradientStop Offset="0.4" Color="DarkGreen" />
<GradientStop Offset="0.6" Color="Chartreuse" />
<GradientStop Offset="0.8" Color="Yellow" />
<GradientStop Offset="1.0" Color="Red" />
</s:HeatmapColorPalette.GradientStops>
</s:HeatmapColorPalette>
</s:FastUniformHeatmapRenderableSeries.ColorMap>
</s:FastUniformHeatmapRenderableSeries>
</s:SciChartSurface.RenderableSeries>
<s:SciChartSurface.XAxis>
<s:NumericAxis DrawMajorBands="True" />
</s:SciChartSurface.XAxis>
<s:SciChartSurface.YAxis>
<s:NumericAxis DrawMajorBands="True" />
</s:SciChartSurface.YAxis>
<s:SciChartSurface.ChartModifier>
<s:ModifierGroup>
<s:TooltipModifier ShowTooltipOn="Always" UseInterpolation="True" ReceiveHandledEvents="True" />
<s:RubberBandXyZoomModifier ExecuteOn="MouseLeftButton" />
<s:ZoomExtentsModifier ExecuteOn="MouseDoubleClick" />
</s:ModifierGroup>
</s:SciChartSurface.ChartModifier>
</s:SciChartSurface>
</Grid>
</UserControl>
// *************************************************************************************
// SCICHART® Copyright SciChart Ltd. 2011-2022. All rights reserved.
//
// Web: http://www.scichart.com
// Support: support@scichart.com
// Sales: sales@scichart.com
//
// HeatMapExampleView.xaml.cs is part of the SCICHART® Examples. Permission is hereby granted
// to modify, create derivative works, distribute and publish any part of this source
// code whether for commercial, private or personal use.
//
// The SCICHART® examples are distributed in the hope that they will be useful, but
// without any warranty. It is provided "AS IS" without warranty of any kind, either
// expressed or implied.
// *************************************************************************************
using System;
using System.Windows;
using System.Windows.Controls;
using SciChart.Charting.Model.DataSeries;
using SciChart.Charting.Model.DataSeries.Heatmap2DArrayDataSeries;
using SciChart.Charting.Visuals.RenderableSeries;
namespace SciChart.Examples.Examples.HeatmapChartTypes.RealTimeHeatmap
{
/// <summary>
/// demonstrates use of FastHeatmapRenderableSeries
/// creates a list of Heatmap2dArrayDataSeries and displays them one by one in loop on timer
/// </summary>
public partial class ContoursExampleView : UserControl
{
public ContoursExampleView()
{
InitializeComponent();
heatmapSeries.DataSeries = CreateSeries(3, 300, 200, heatmapSeries.ColorMap.Maximum);
contourSeries.DataSeries = heatmapSeries.DataSeries;
}
private IDataSeries CreateSeries(int index, int width, int height, double cpMax)
{
var w = width;
var h = height;
var angle = Math.PI * 2 * index / 30;
var data = new double[h, w];
var smallValue = 0d;
for (int x = 0; x < w; x++)
{
for (int y = 0; y < h; y++)
{
var v = (1 + Math.Sin(x * 0.04 + angle)) * 50 +
(1 + Math.Sin(y * 0.1 + angle)) * 50 * (1 + Math.Sin(angle * 2));
var cx = w / 2;
var cy = h / 2;
var r = Math.Sqrt((x - cx) * (x - cx) + (y - cy) * (y - cy));
var exp = Math.Max(0, 1 - r * 0.008);
var zValue = (v * exp);
data[y, x] = (zValue > cpMax) ? cpMax : zValue;
data[y, x] += smallValue;
}
smallValue += 0.001;
}
return new UniformHeatmapDataSeries<int, int, double>(data, 0, 1, 0, 1);
}
private void OnApplyMajorStyle(object sender, RoutedEventArgs e)
{
contourSeries.MajorLineStyle = ApplyMajorStyleCkb.IsChecked == true ? (Style)Resources["MajorContourLineStyle"] : null;
sciChart.ZoomExtents();
}
private void OnApplyMinorStyle(object sender, RoutedEventArgs e)
{
contourSeries.MinorLineStyle = ApplyMinorStyleCkb.IsChecked == true ? (Style)Resources["MinorContourLineStyle"] : null;
sciChart.ZoomExtents();
}
private void OnApplyPalette(object sender, RoutedEventArgs e)
{
contourSeries.ColorMap = ApplyPaletteCkb.IsChecked == true ? (HeatmapColorPalette)Resources["ColorPalette"] : null;
sciChart.ZoomExtents();
}
}
}