
The Scatter-Line Series Type
Scatter-Line Series are also provided by the FastLineRenderableSeries type, by applying an optional PointMarker.
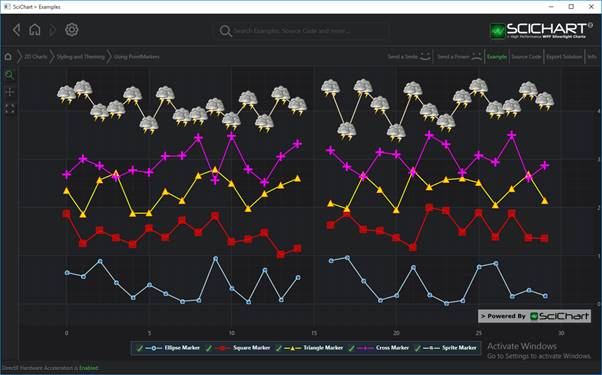
Examples for the Scatter Line Series can be found in the SciChart WPF Examples Suite which can be downloaded from the SciChart Website or our SciChart.WPF.Examples Github Repository.
NOTE: For a detailed description of the PointMarker API, see Point Marker API-BaseRenderableSeries.Pointmarker
PointMarker Types available in SciChart include:
- EllipsePointMarker– draws an ellipse with stroke/fill
- SquarePointMarker– draws a cube with stroke/fill
- TrianglePointMarker– draws a triangle with stroke/fill
- CrossPointMarker– draws a + sign with stroke
- XPointMarker– draws an x sign with stroke
- InvertedTrianglePointMarker– draws an inverted triangle with stroke/fill
- SpritePointMarker(allows any UIElement to be turned into a PointMarker)
- BitmapSpriteBase(allows drawing using our RenderContext API as a PointMarker)
To declare a FastLineRenderableSeries with PointMarker use the following code:
Declare a FastLineRenderableSeries With EllipsePointMarker in Xaml / Code Behind
| Declare a FastLineRenderableSeries With EllipsePointMarker |
Copy Code |
|---|---|
<!-- where xmlns:s="http://schemas.abtsoftware.co.uk/scichart" --> <s:SciChartSurface> <s:SciChartSurface.RenderableSeries> <s:FastLineRenderableSeries x:Name="lineSeries" Stroke="OrangeRed"> <s:FastLineRenderableSeries.PointMarker> <s:EllipsePointMarker Width="5" Height="5"/> </s:FastLineRenderableSeries.PointMarker> </s:FastLineRenderableSeries> </s:SciChartSurface.RenderableSeries> <!-- XAxis, YAxis omitted for brevity --> </s:SciChartSurface> // Code Behind, e.g. in OnLoaded event handler, set the DataSeries var dataSeries = new XyDataSeries<double, double>(); for(int i = 0; i < 100; i++) dataSeries.Append(i, Math.Sin(i*0.2)); lineSeries.DataSeries = dataSeries; | |
Declare a FastLineRenderableSeries with EllipsePointMarker in Pure Code
| Declare a FastLineRenderableSeries with EllipsePointMarker |
Copy Code |
|---|---|
// Declare the scichartsurface var sciChartSurface = new SciChartSurface(); // ... // Declare and add a Scatter-Line Series var lineSeries = new FastLineRenderableSeries() { Stroke = Colors.OrangeRed, PointMarker = new EllipsePointMarker() { Width=5, Height=5 }, }; sciChartSurface.RenderableSeries.Add(lineSeries); // Set some data var dataSeries = new XyDataSeries<double, double>(); for(int i = 0; i < 100; i++) dataSeries.Append(i, Math.Sin(i*0.2)); lineSeries.DataSeries = dataSeries; | |
NOTE: You can also declare FastLineRenderableSeries using full MVVM (series ViewModels). Please see MVVM DataSeries / RenderableSeries API for more details
See Also