
Tooltips in SciChart3D are performed by the TooltipModifier3D. This is a ChartModifierBase3D derived type which executes on Mouse Move to to show tooltips for the data-points under the mouse.
Declaring a TooltipModifier3D in XAML
Declaring a TooltipModifier3D is as simple as adding one to the SciChart3DSurface.ChartModifier property. This can be done as a single modifier, or as part of a ModifierGroup3D.
Excluding Tooltips for Specific Series
You can exclude a specific RenderableSeries from the TooltipModifier3D by setting the attached property ies to false. By default this is true for all RenderableSeries.
Styling the Tooltip Item Template
The tooltip item template can be styled in exactly the same was as the RolloverModifier, via the TooltipModifier3D.TooltipTemplate attached property. This defines a DataTemplate for some UI which binds to an instance of SeriesInfo. For a full description of the SeriesInfo types please see RolloverModifier
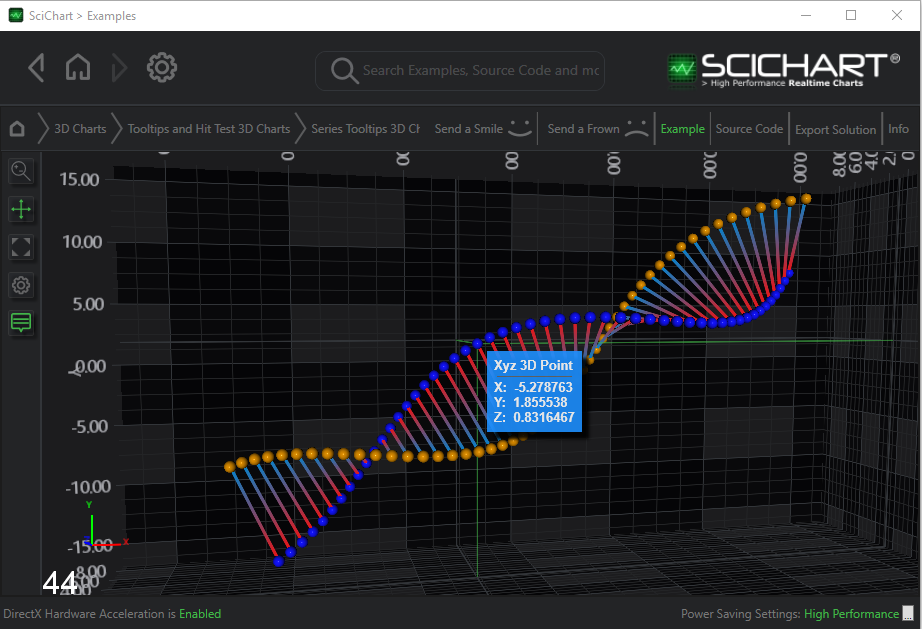
| Styling the Tooltip Item Template for XyzDataSeries3D |
Copy Code |
|---|---|
<s3D:SciChart3DSurface x:Name="scs" > <!-- XAxis, YAxis, RenderableSeries omitted for brevity --> <s3D:SciChart3DSurface.ChartModifier> <s3D:ModifierGroup3D> <!-- Add the OrbitModifier3D to the chart. Optional. add other modifiers --> <s3D:OrbitModifier3D DegreesPerPixel="0.2" IsEnabled="True" ExecuteOn="MouseLeftButton"/> </s3D:ModifierGroup3D> </s3D:SciChart3DSurface.ChartModifier> </s3D:SciChart3DSurface> <!-- where xmlns:s3D="http://schemas.abtsoftware.co.uk/scichart3D" --> <s3D:SciChart3DSurface> <s3D:SciChart3DSurface.Resources> <s3D:Vector3ComponentConverter x:Key="Vector3ComponentConverter" /> <DataTemplate x:Key="XyzSeriesTooltipTemplate" DataType="cd:BaseXyzSeriesInfo3D"> <StackPanel Orientation="Vertical"> <TextBlock> <Run FontWeight="Bold" Text="{Binding SeriesName, FallbackValue='Xyz 3D Point', TargetNullValue='Xyz 3D Point'}" /> </TextBlock> <Border Height="1" Margin="3" HorizontalAlignment="Stretch" Background="DimGray" BorderThickness="0" /> <TextBlock> <Run FontWeight="Bold" Text="X: " /> <Run Text="{Binding HitVertex, Converter={StaticResource Vector3ComponentConverter}, ConverterParameter='X'}" /> </TextBlock> <TextBlock> <Run FontWeight="Bold" Text="Y: " /> <Run Text="{Binding HitVertex, Converter={StaticResource Vector3ComponentConverter}, ConverterParameter='Y'}" /> </TextBlock> <TextBlock> <Run FontWeight="Bold" Text="Z: " /> <Run Text="{Binding HitVertex, Converter={StaticResource Vector3ComponentConverter}, ConverterParameter='Z'}" /> </TextBlock> </StackPanel> </DataTemplate> </s3D:SciChart3DSurface.Resources> <s3D:SciChart3DSurface.RenderableSeries> <s3D:XyScatterRenderableSeries3D s3D:TooltipModifier3D.IncludeSeries="False" s3D:TooltipModifier3D.TooltipTemplate="{StaticResource XyzTooltipTemplate}"//> </s3D:SciChart3DSurface.RenderableSeries> </s3D:SciChartSurface> | |
Different types of series accept different ttemplates for the tooltip. For example, the template for a SurfaceMeshRenderableSeries3D looks like this.
| Default templates for Uniform Grid / Waterfall series |
Copy Code |
|---|---|
<!-- The default template for a Uniform Grid Data Series --> <DataTemplate x:Key="UniformGridSeriesTooltipTemplate" DataType="cd:SurfaceMeshSeriesInfo3D"> <StackPanel Orientation="Vertical"> <TextBlock> <Run FontWeight="Bold" Text="{Binding SeriesName, FallbackValue='Uniform Data Point', TargetNullValue='Uniform Data Point'}" /> </TextBlock> <Border Height="1" Margin="3" HorizontalAlignment="Stretch" Background="DimGray" BorderThickness="0" /> <TextBlock> <Run FontWeight="Bold" Text="Cell Index: " /> <Run Text="z=" /> <Run Text="{Binding Z}" /> <Run Text=", x=" /> <Run Text="{Binding X}" /> </TextBlock> <TextBlock> <Run FontWeight="Bold" Text="X Data: " /> <Run Text="{Binding HitVertex, Converter={StaticResource Vector3ComponentConverter}, ConverterParameter='X'}" /> </TextBlock> <TextBlock> <Run FontWeight="Bold" Text="Y Data: " /> <Run Text="{Binding HitVertex, Converter={StaticResource Vector3ComponentConverter}, ConverterParameter='Y'}" /> </TextBlock> <TextBlock> <Run FontWeight="Bold" Text="Z Data: " /> <Run Text="{Binding HitVertex, Converter={StaticResource Vector3ComponentConverter}, ConverterParameter='Z'}" /> </TextBlock> </StackPanel> </DataTemplate> <!-- The default tooltip template for a waterfall 3D series --> <DataTemplate x:Key="WaterfallSeriesTooltipTemplate" DataType="cd:SurfaceMeshSeriesInfo3D"> <StackPanel Orientation="Vertical"> <TextBlock> <Run FontWeight="Bold" Text="X Data: " /> <Run Text="{Binding HitVertex, Converter={StaticResource Vector3ComponentConverter}, ConverterParameter='X'}" /> </TextBlock> <TextBlock> <Run FontWeight="Bold" Text="Y Data: " /> <Run Text="{Binding HitVertex, Converter={StaticResource Vector3ComponentConverter}, ConverterParameter='Y'}" /> </TextBlock> <TextBlock> <Run FontWeight="Bold" Text="Z Data: " /> <Run Text="{Binding HitVertex, Converter={StaticResource Vector3ComponentConverter}, ConverterParameter='Z'}" /> </TextBlock> </StackPanel> </DataTemplate> | |
Styling the Tooltip Container Style
The tooltip container can be styled in exactly the same way as the RolloverModifier, via the TooltipModifier3D.TooltipContainerStyle attached property.
| Styling the Tooltip Container Style |
Copy Code |
|---|---|
<s:SciChart3DSurface> <s:SciChart3DSurface.Resources> <!-- The TooltipControl template is defined below --> <!-- Change this if you want to have a non-default tooltip container --> <!-- The ContentPresenter is bound to the DataContext (a SeriesInfo type) --> <!-- and the ContentTemplate is the DataTemplate for the SeriesInfo --> <!-- Finally, the TooltipContainerStyle is set on the RenderableSeries --> <Style x:Key="TooltipStyle1" TargetType="s:TooltipControl"> <Setter Property="Template"> <Setter.Value> <ControlTemplate TargetType="s:TooltipControl"> <Border Background="#ff6495ed" BorderBrush="#ff4d81dd" BorderThickness="2" Effect="{StaticResource DropShadowEffect}" Opacity="0.9" Padding="5"> <ContentPresenter Content="{TemplateBinding DataContext}" ContentTemplate="{TemplateBinding ContentTemplate}" /> </Border> </ControlTemplate> </Setter.Value> </Setter> </Style> </s:SciChartSurface.Resources> <s:SciChart3DSurface.RenderableSeries> <s:ScatterRenderableSeries3D s:TooltipModifier3D.TooltipContainerStyle="{StaticResource TooltipStyle1}"/> </s:SciChart3DSurface.RenderableSeries> </s:SciChartSurface> | |
Changing the Tooltip DataContext
The TooltipModifier features the ability to easily change the DataContext (or viewmodel) for Tooltips, via the TooltipModifier3D.TooltipLabelDataContextSelector property.
In the Examples > 2D Charts > Tooltips and Hit Test > Using TooltipModifier Tooltips example, the 2D Chart Chart tooltipmodifier is used to show you how to bind the TooltipLabelDataContextSelector property to a ViewModel property, allowing you to wrap extra info around the SeriesInfo provided by SciChart. This lets you inject extra information into the tooltips easily.
The mechanism is the same for 3D Charts, so you can use this example above to show you how to change the DataContext for 3D Charts.