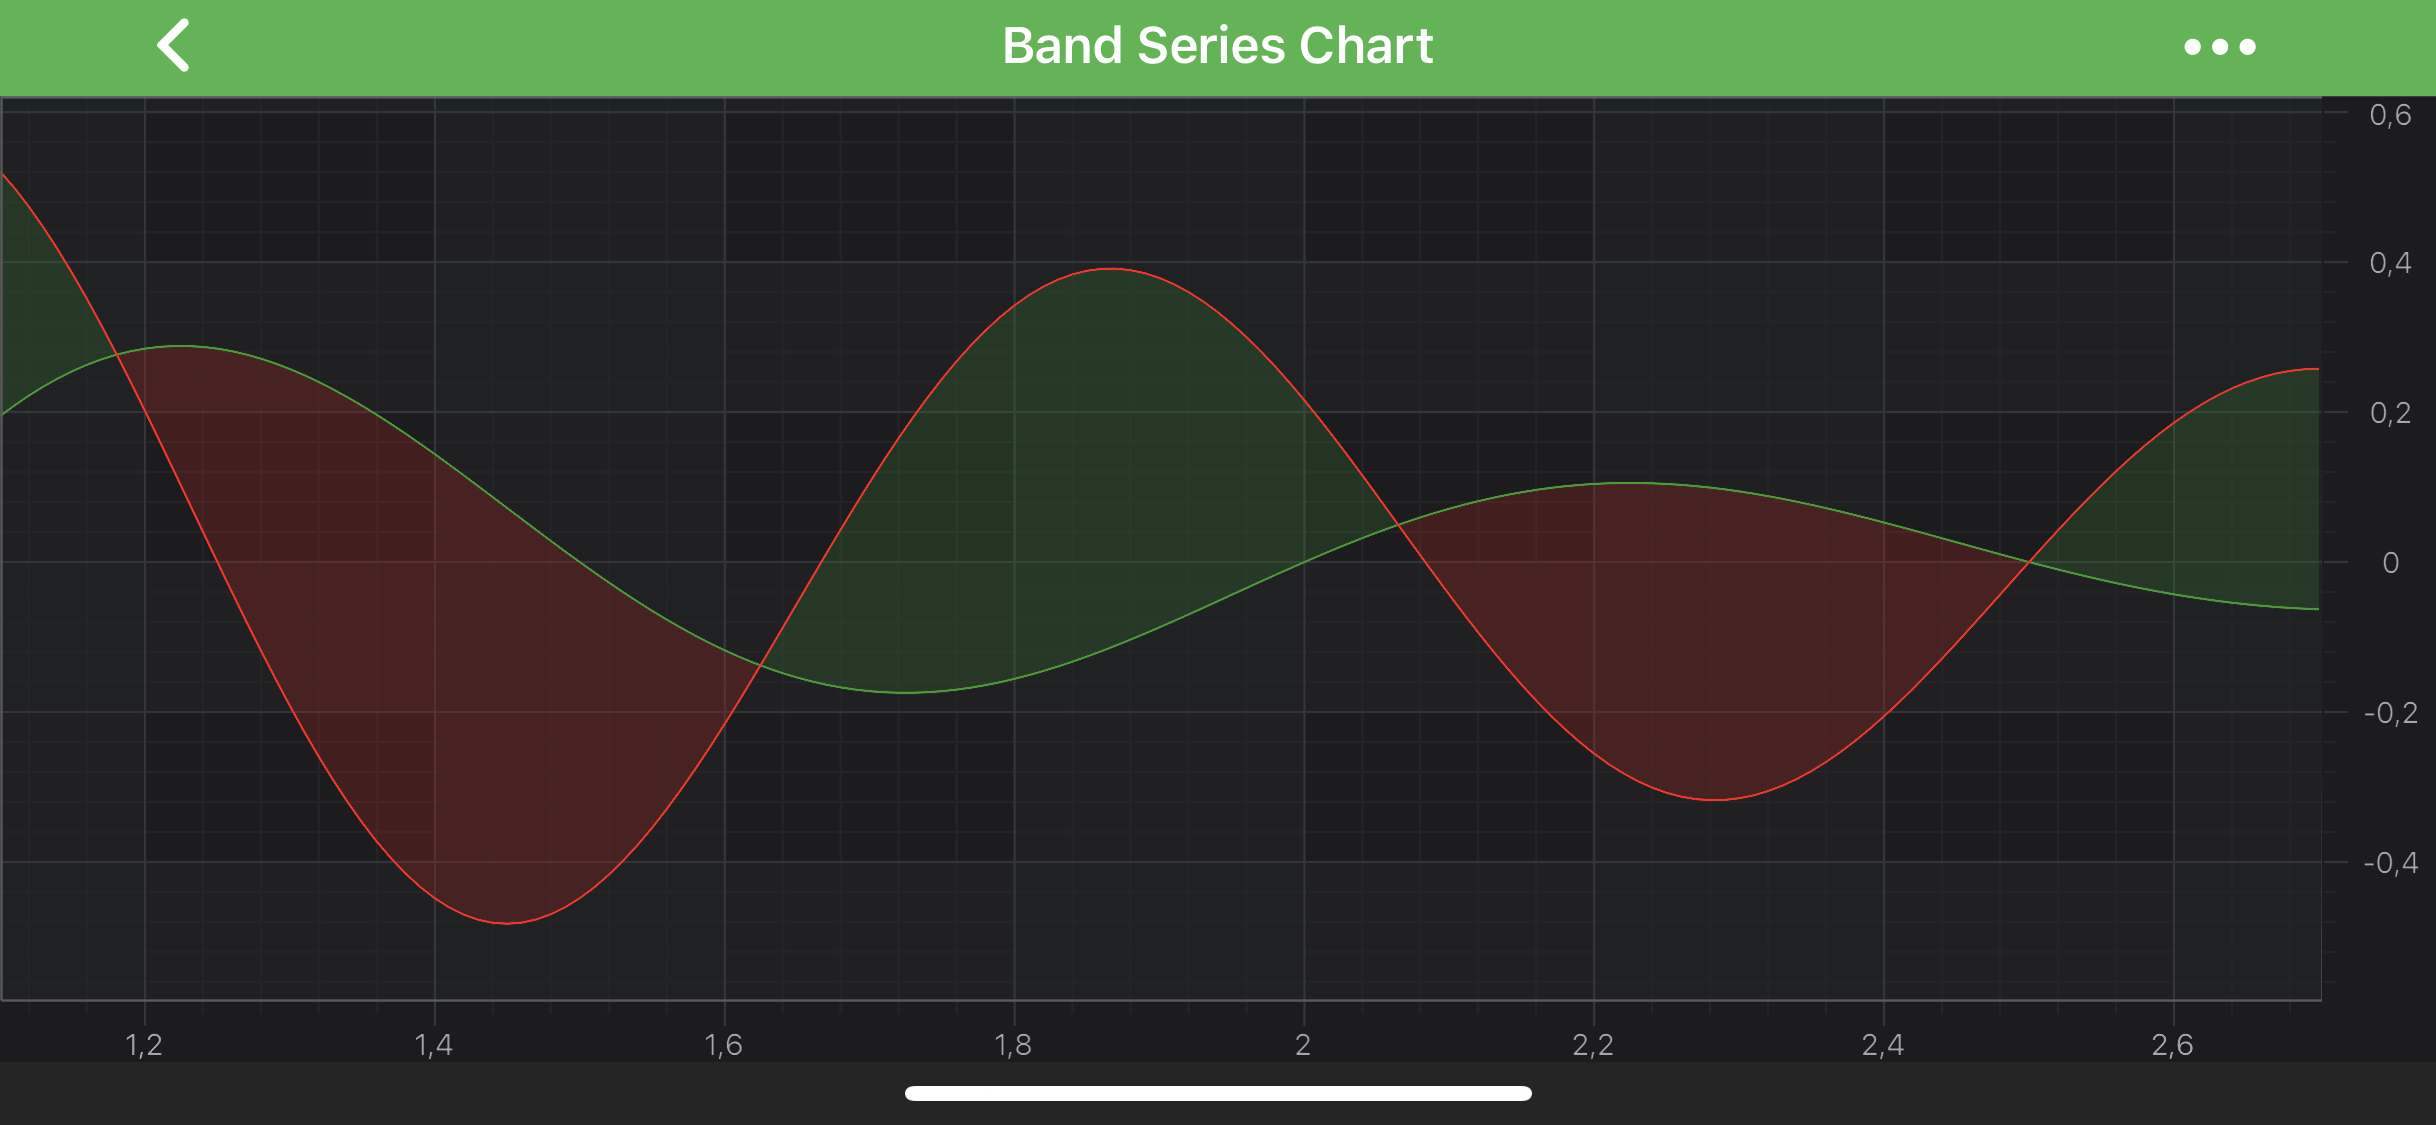
The Band Series Type
High-Low Fill or Band Series are provided by the FastBandRenderableSeries type. This accepts data (X, Y, Y1) from a XyyDataSeries<TX,TY> and renders two lines with a polygon, which changes color depending on whether Y > Y1 or vice versa.
Note
For more info about XyyDataSeries<TX,TY>, as well as other DataSeries types in SciChart, see the DataSeries API article.
The Band Series can be used to render profit & loss (green / red above or below a zero line), shaded areas of interest, technical indicators such as MACD and Ichimoku, or to simply shade an area above or below a threshold.
Note
Examples for the Band Series can be found in the SciChart Android Examples Suite as well as on GitHub:
The FastBandRenderableSeries class allows to specify Fill, FillY1 brushes and Stroke, StrokeY1 pens via the following properties:
Note
To learn more about Pens and Brushes and how to utilize them, please refer to the PenStyle, BrushStyle and FontStyle article.
Note
In multi axis scenarios, a series has to be assigned to particular X and Y axes. This can be done passing the axes IDs to the xAxisId, yAxisId properties.
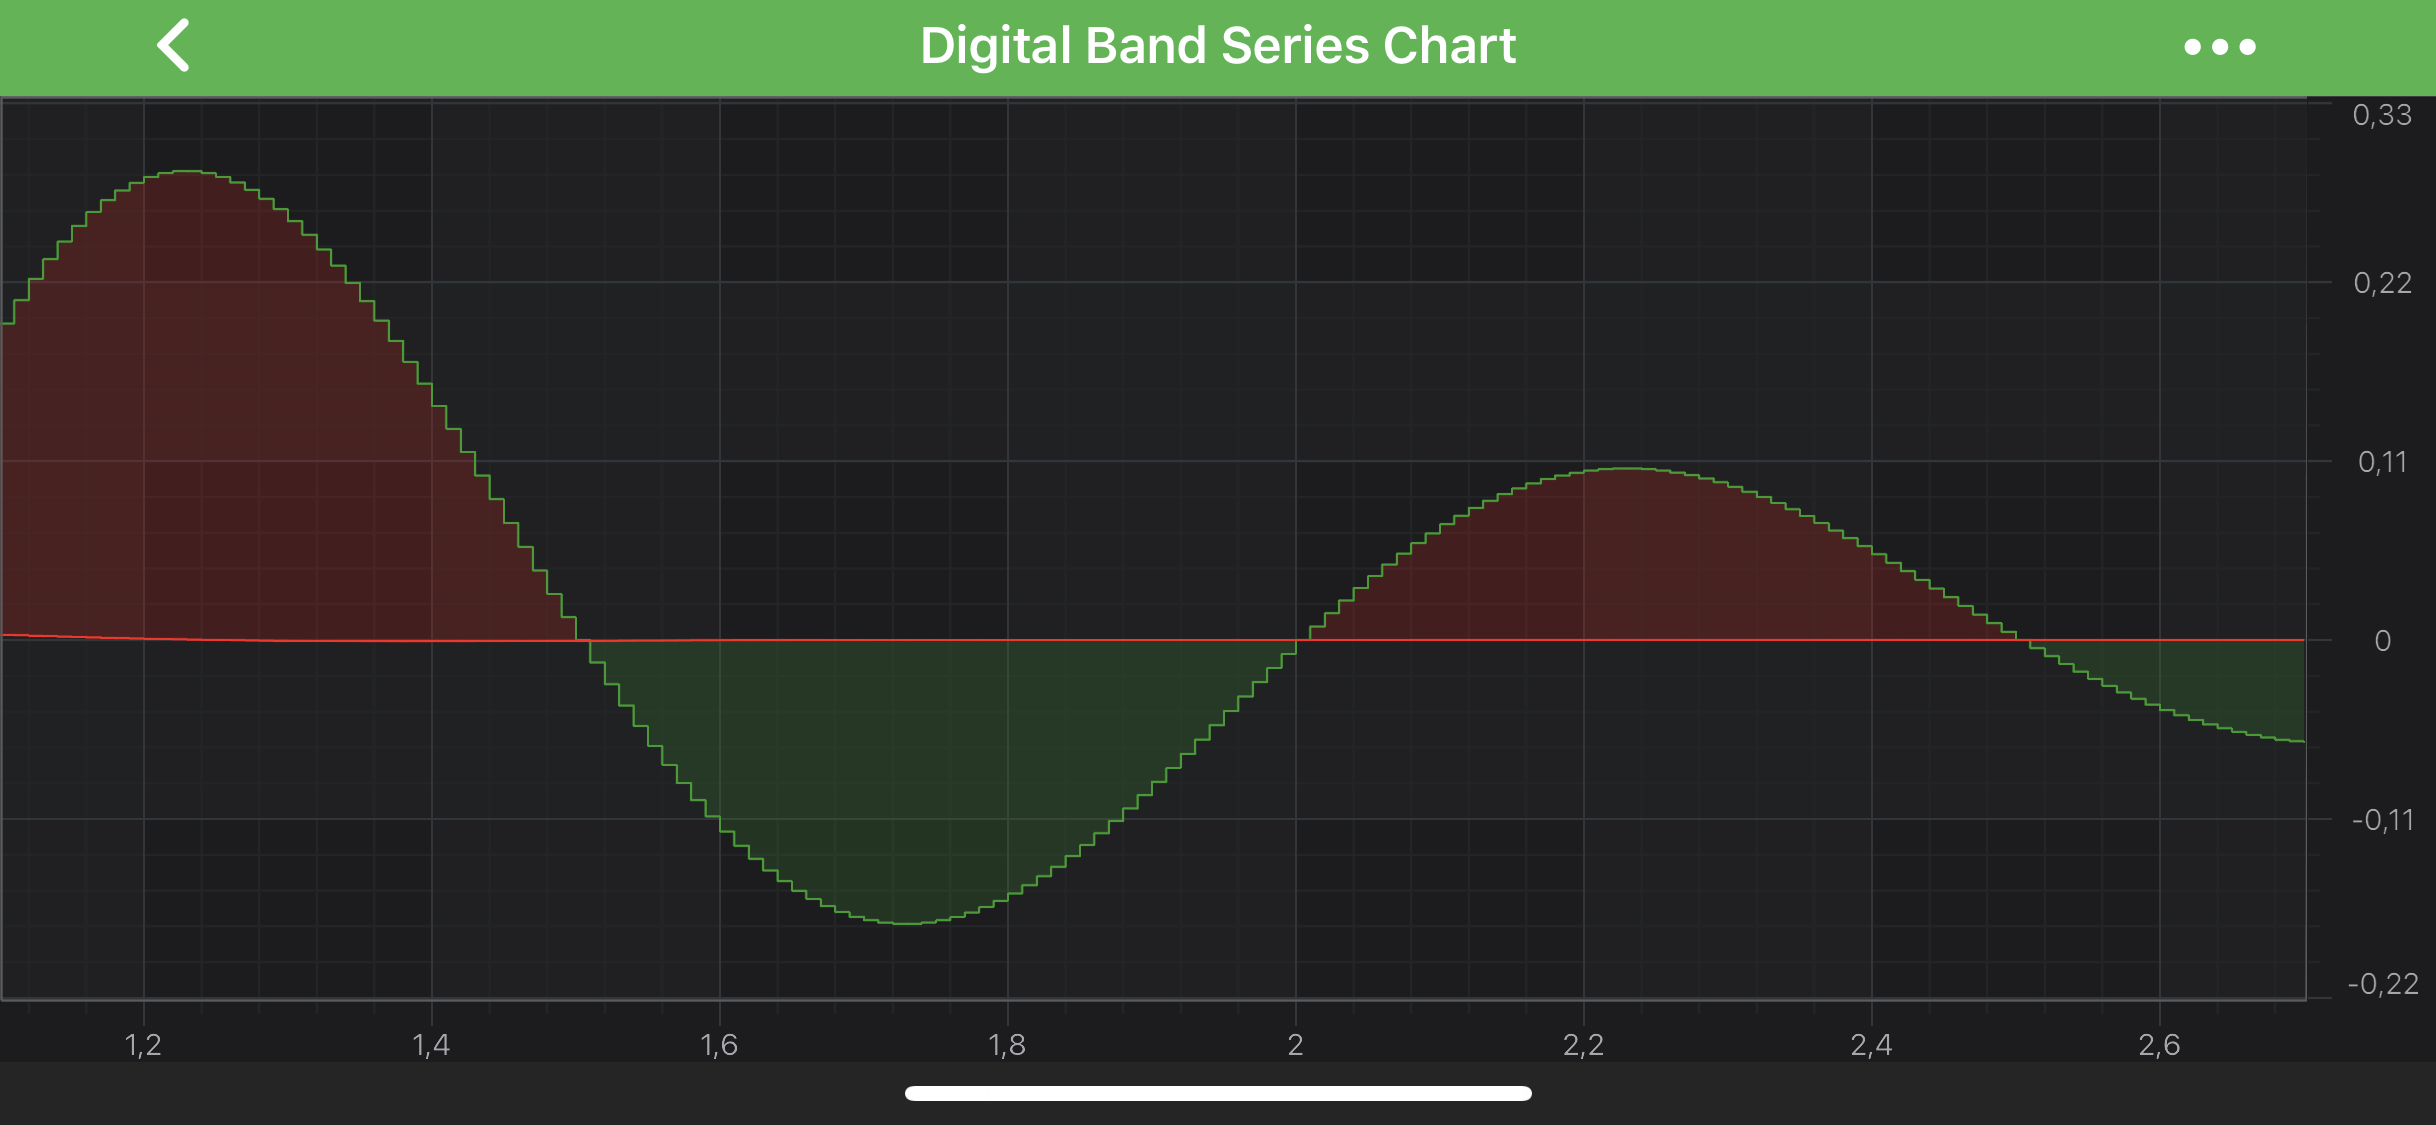
Digital (Step) Band Series
In addition to the above, FastBandRenderableSeries can be configured to drawn as Digital (Step) Band. It is achieved via the isDigitalLine property.
Create a Band Series
To create a Band Series, use the following code:
@Override
protected void initExample(@NonNull SciChartSurface surface) {
    final IXyyDataSeries<Double, Double> dataSeries = new XyyDataSeries<>(Double.class, Double.class);
    dataSeries.append(0.0, 0.0, 1.0);
    dataSeries.append(1.0, 1.0, 0.0);
    dataSeries.append(2.0, 4.0, 0.0);

    final FastBandRenderableSeries bandSeries = new FastBandRenderableSeries();

    bandSeries.setDataSeries(dataSeries);
    bandSeries.setStrokeStyle(new SolidPenStyle(Color.RED, true, 1f, null));
    bandSeries.setStrokeY1Style(new SolidPenStyle(Color.BLUE, true, 1f, null));

    bandSeries.setFillBrushStyle(new SolidBrushStyle(Color.CYAN));
    bandSeries.setFillY1BrushStyle(new SolidBrushStyle(Color.YELLOW));

    UpdateSuspender.using(surface, () -> {
        Collections.addAll(surface.getXAxes(), new NumericAxis(requireContext()));
        Collections.addAll(surface.getYAxes(), new NumericAxis(requireContext()));

        Collections.addAll(surface.getRenderableSeries(), bandSeries);
    });
}
Band Series Features
Band Series also has some features similar to other series, such as:
Render a Gap in a Band Series
It's possible to render a Gap in Band series, by passing a data point with a NaN as the Y and Y1 value. Please refer to the RenderableSeries APIs article for more details. The FastBandRenderableSeries, however, allows to specify how a gap should appear. You can treat NAN values as gaps or close the line. That's defined by the drawNaNAs property (Please see LineDrawMode enumeration).
Add Point Markers onto a Band Series
Every data point of a Band Series can be marked with a IPointMarker. To add Point Markers to a Band Series use the pointMarker property. For more information and code examples, please refer to the PointMarkers API article.
Paint Band Area Parts with Different Colors
In SciChart, you can draw Band Series segments with different colors using the PaletteProvider API. To Use palette provider for Band Series - a custom IFillPaletteProvider (or IStrokePaletteProvider) has to be provided to the paletteProvider property. Please refer to the PaletteProvider API article for more info.