CursorModifier
SciChart features a Cursor or Crosshair modifier provided by the CursorModifier.
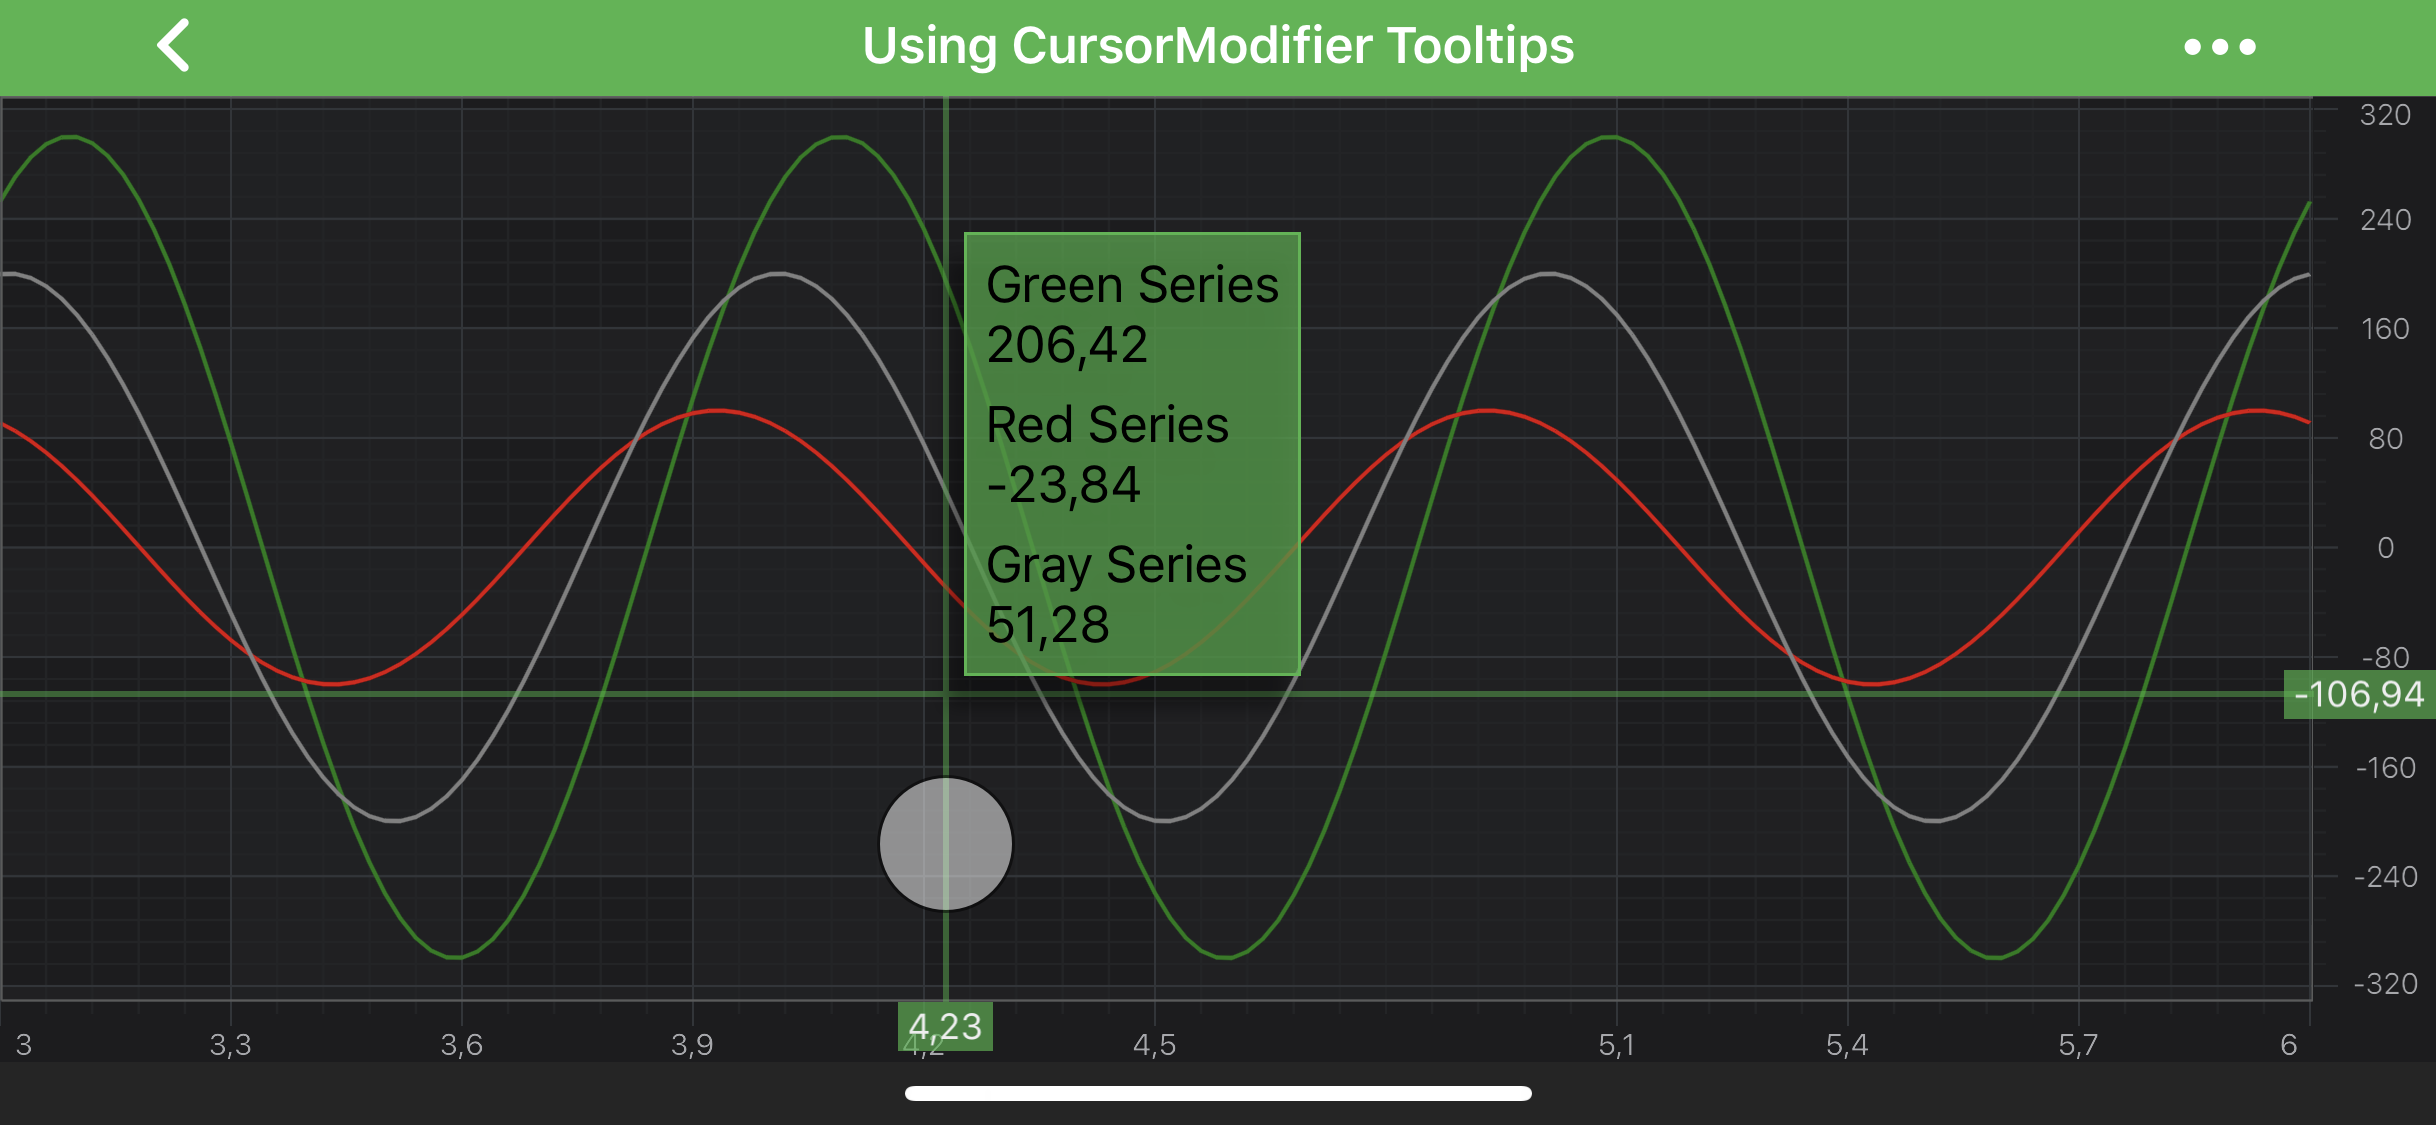
It allows to display a crosshair at the touch-point and X-Axis and/or Y-Axis labels.
The CursorModifier is also able to display an aggregated tooltip (all series in one tooltip).
Note
Examples of the CursorModifier usage can be found in the SciChart Android Examples Suite as well as on GitHub:
CursorModifier Usage
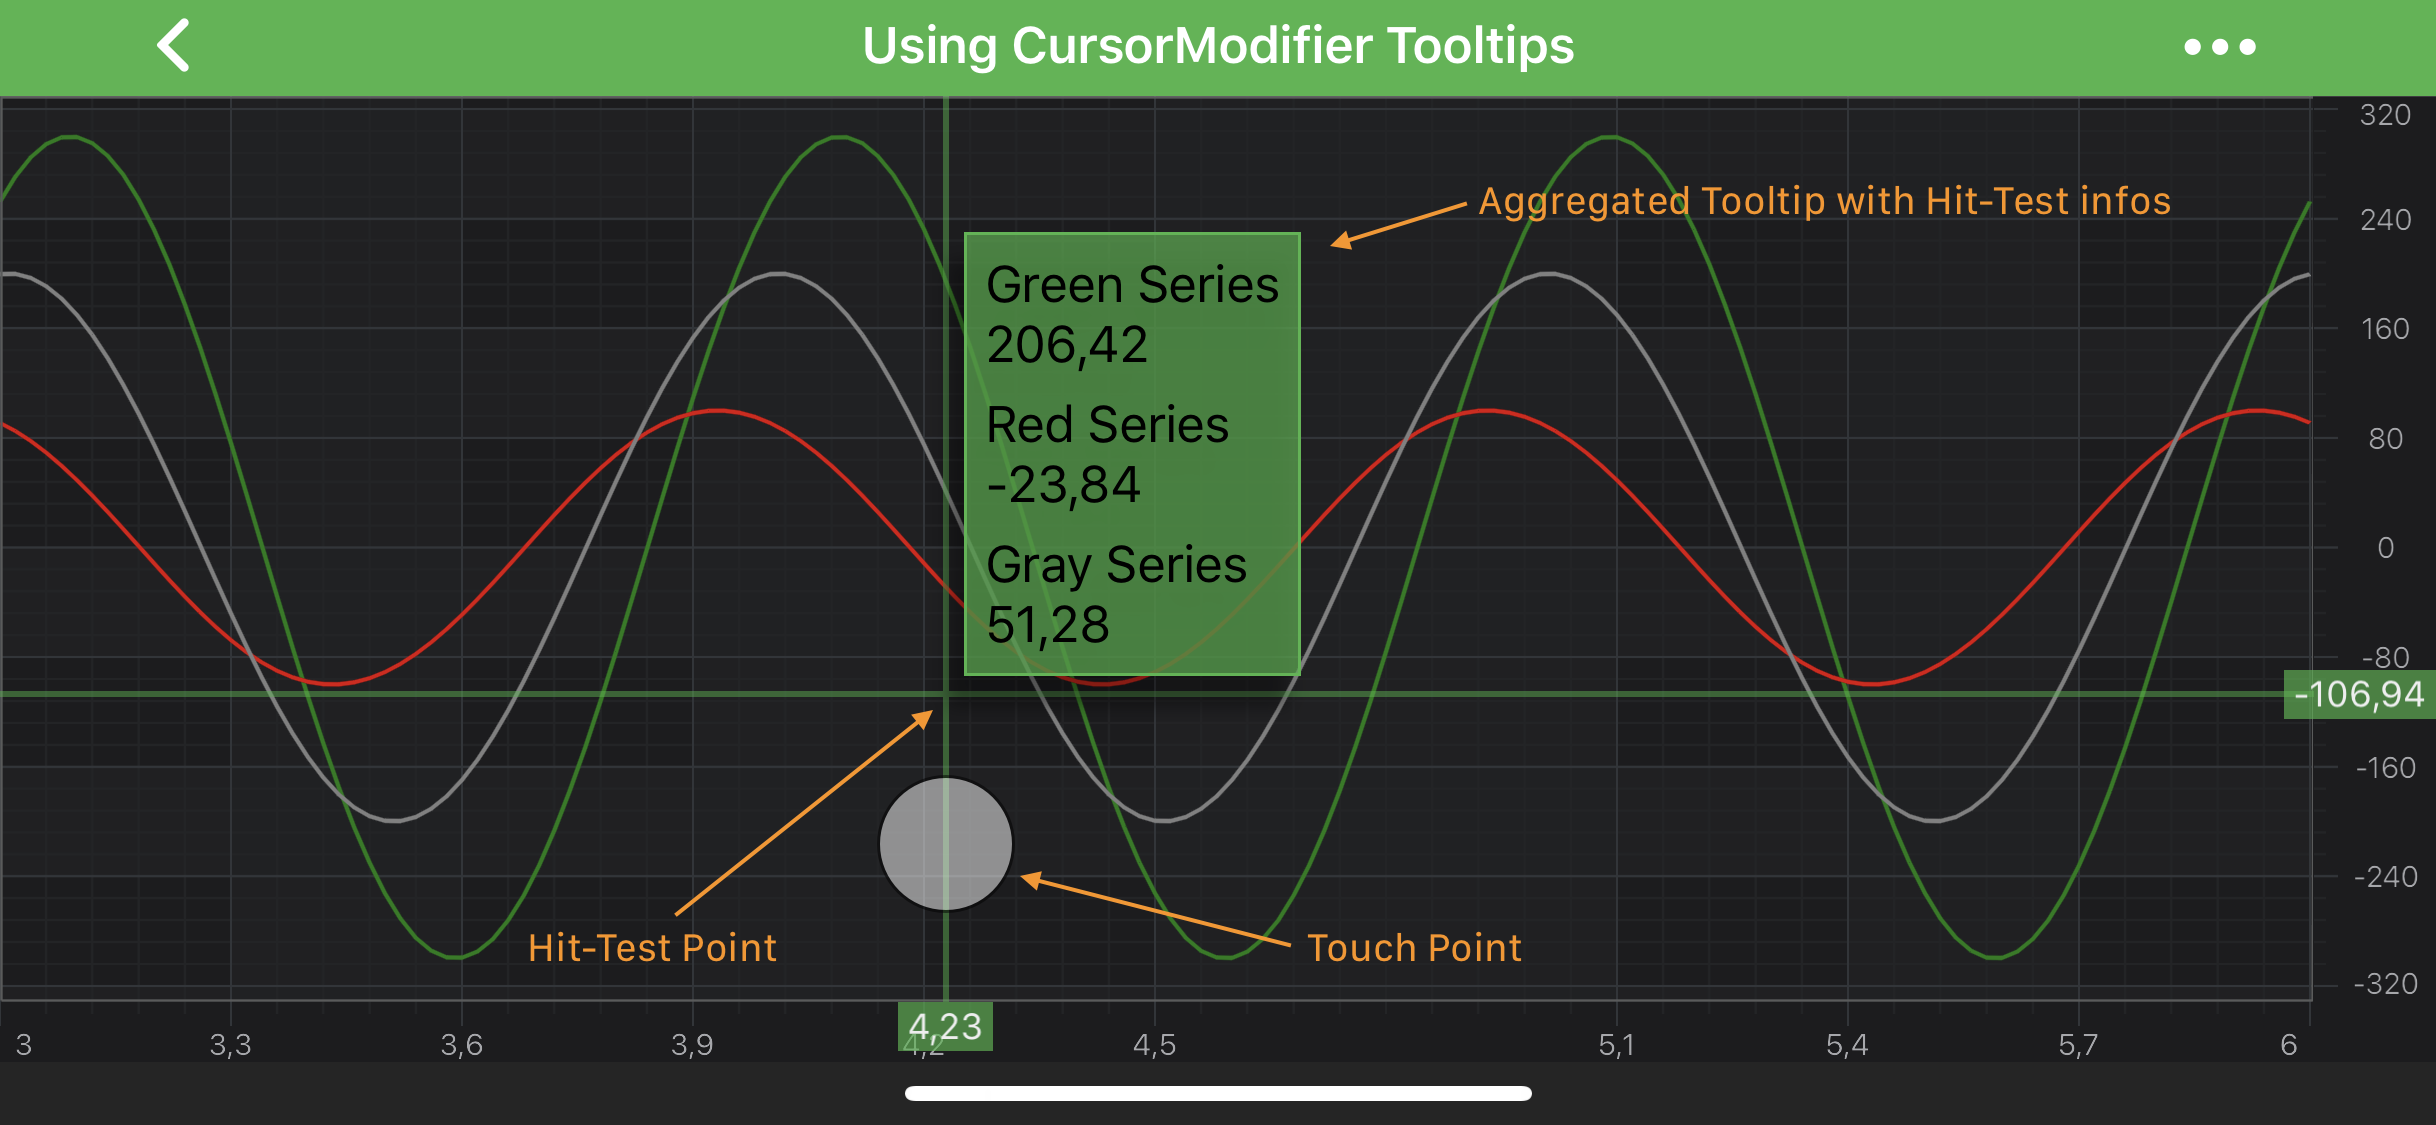
The CursorModifier allows inspecting RenderableSeries at a touch point. For convenience, the actual hit-test point is located a bit upper. Tooltips will appear to the side of it, showing the hit-test result for all RenderableSeries above the cursor horizontal line. Also, the CursorModifier shows labels on axes for its horizontal, vertical lines.
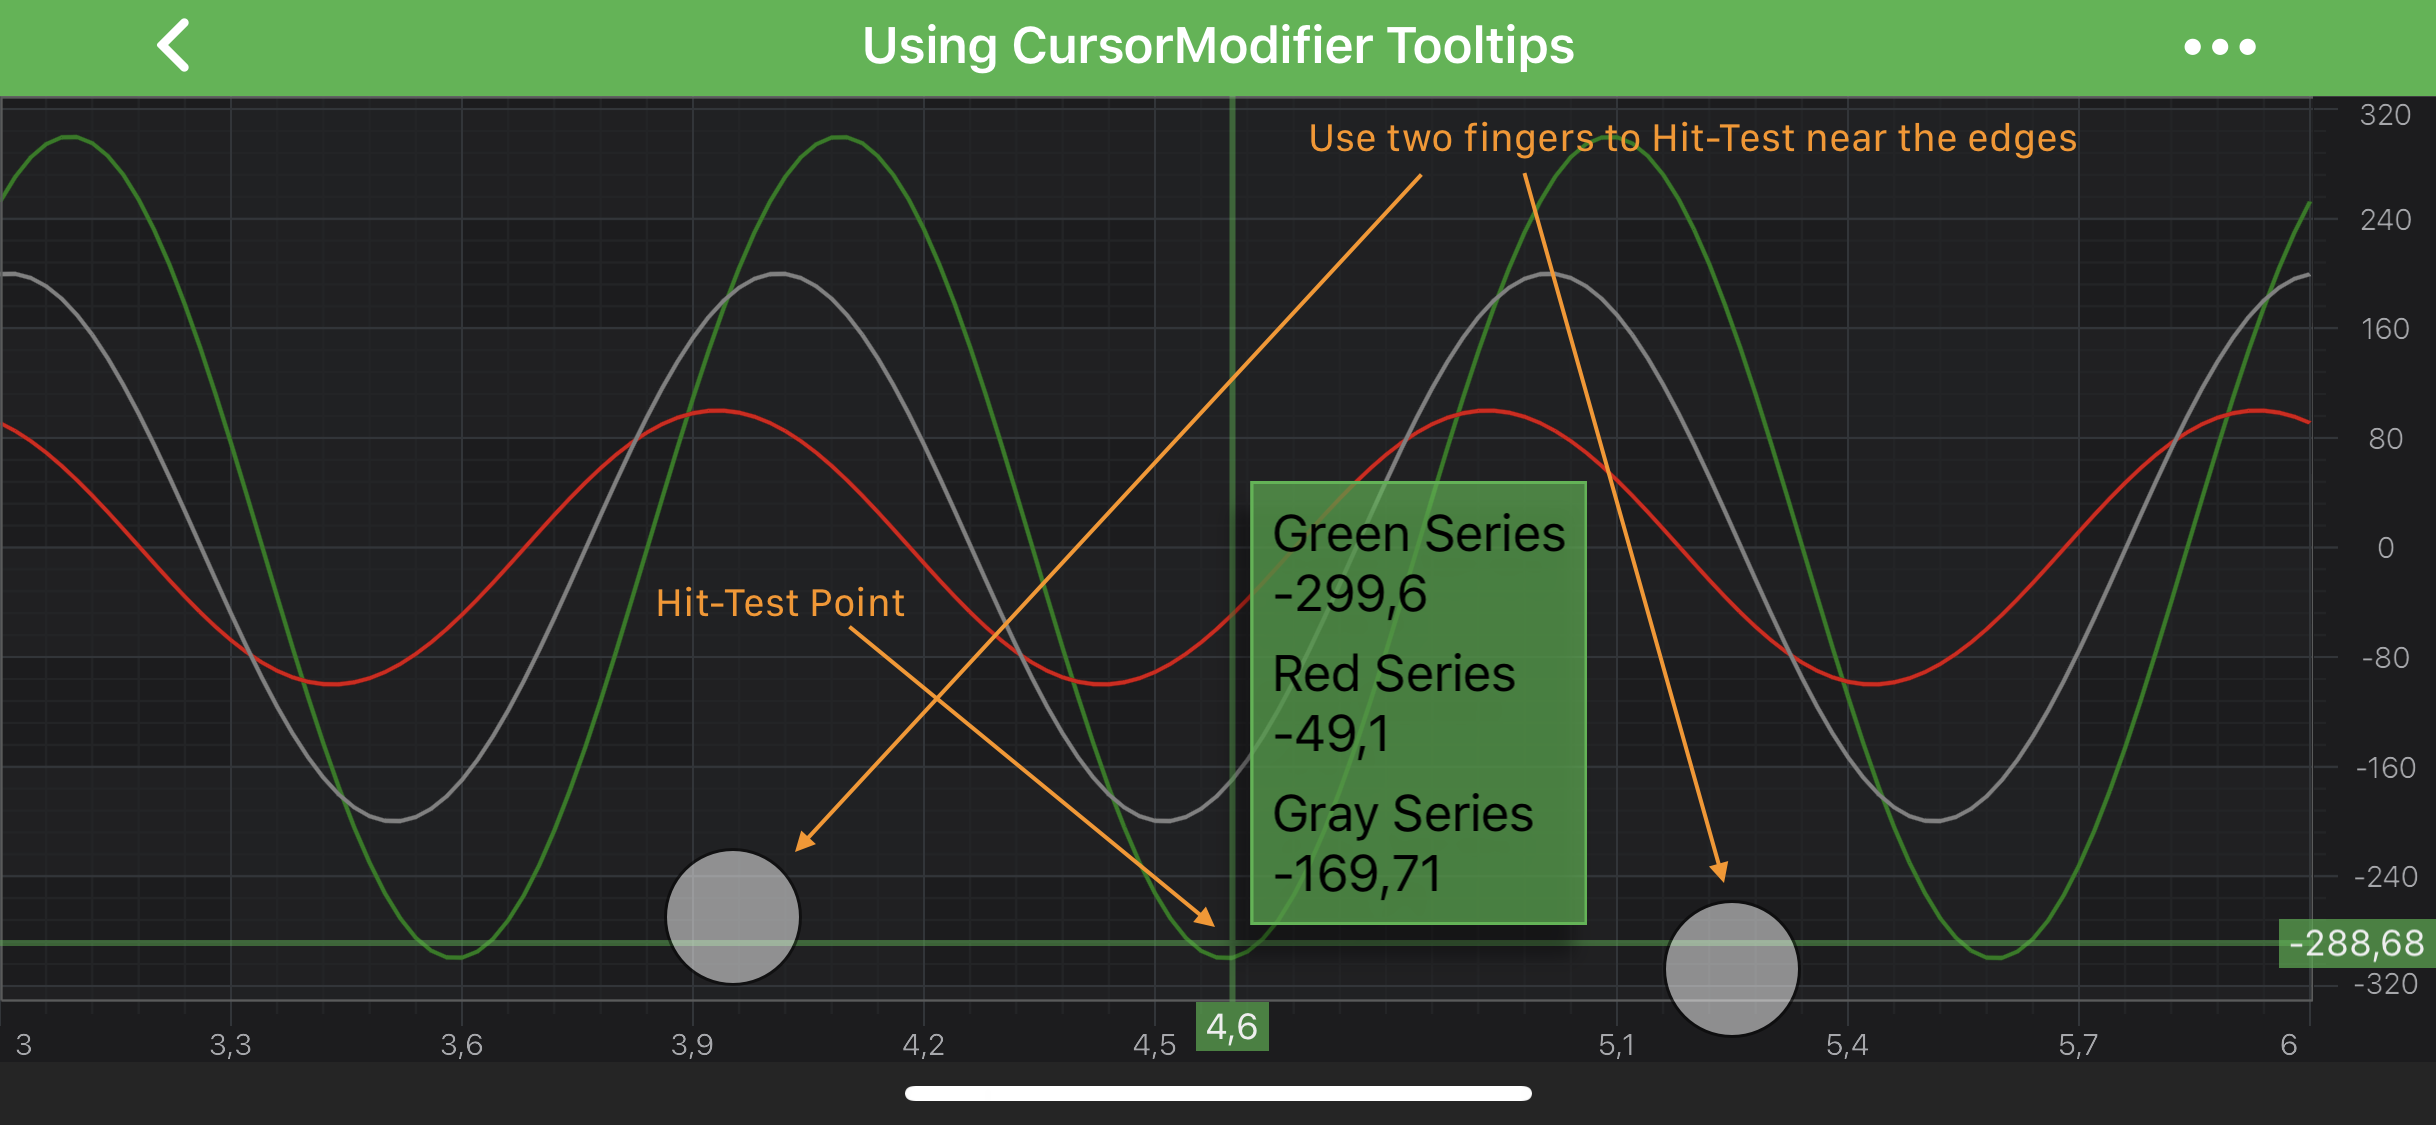
For hit-testing series parts that are close to the chart boundaries, a multi-touch finger drag can be used:
CursorModifier Features
Besides the CursorModifier specific features, there are some common features which are shared between TooltipModifier, RolloverModifier and CursorModifier via common TooltipModifierBase class.
Common Features
| Feature | Description |
|---|---|
| setShowTooltip(boolean showTooltip) | Allows to hide or show modifier's Tooltips. |
| setUseInterpolation(boolean useInterpolation) | Allows to show interpolated values between data points. It is a true by default. If false - modifier's Tooltips will report the info about closest data points. |
| setSourceMode(SourceMode sourceMode) | Allows to specify which IRenderableSeries are to be inspected by a modifier, e.g. Visible, Selected, etc. Other will be ignored by the modifier. Expects a member of the SourceMode enumeration. |
Specific Features
| Feature | Description |
|---|---|
| setOffset(float offset) | Specifies how far the hit-test point is from the actual touch point. This value will be used for either X or Y coordinate, or both, depending on markerPlacement. |
| setCustomPointOffset(PointF customPointOffset) | Specifies how far the hit-test point is from the actual touch point. As opposed to offset, both X and Y coordinate will always be applied. |
| setMarkerPlacement(Placement markerPlacement) | Allows to specify the position of the hit-test point relative to the touch point, e.g. Left, Top, etc... Expects a member of the Placement enumeration. |
| setTooltipPosition(TooltipPosition tooltipPosition) | Allows to specify the position of modifier's Tooltips relative to the hit-test point, e.g. TopLeft, BottomRight, etc.... Expects a member of the TooltipPosition enumeration. |
| getCrosshairPaint() | Returns the Paint object that is responsible for the crosshair ("sniper aim") drawing (marking the hit-test point). Can be used to change style and color properties of the crosshair. |
Adding a CursorModifier to a Chart
Any Chart Modifier can be added to a SciChartSurface via the chartModifiers property and CursorModifier is no difference:
// Assume a surface has been created and configured somewhere
surface.getChartModifiers().add(new CursorModifier());
Creating a Custom CursorModifier tooltip
Below is the example to create a custom CursorModifier tooltip
private static class CustomSeriesInfoProvider extends DefaultXySeriesInfoProvider {
    @Override
    protected ISeriesTooltip getSeriesTooltipInternal(Context context, XySeriesInfo<?> seriesInfo, Class<?> modifierType) {
        if (modifierType == CursorModifier.class) {
            return new CustomXySeriesTooltip(context, seriesInfo);
        } else {
            return super.getSeriesTooltipInternal(context, seriesInfo, modifierType);
        }
    }

    private static class CustomXySeriesTooltip extends XySeriesTooltip {
        public CustomXySeriesTooltip(Context context, XySeriesInfo<?> seriesInfo) {
            super(context, seriesInfo);

            final DisplayMetrics displayMetrics = context.getResources().getDisplayMetrics();
            final int padding = Math.round(TypedValue.applyDimension(TypedValue.COMPLEX_UNIT_DIP, 1f, displayMetrics));
            this.setPadding(padding, padding, padding, padding);
        }

        @Override
        protected void internalUpdate(XySeriesInfo seriesInfo) {
            final SpannableStringBuilder sb = new SpannableStringBuilder();
            if (seriesInfo.seriesName != null) {
                sb.append(seriesInfo.seriesName).append(" - ");
            }

            sb.append("X: ").append(seriesInfo.getFormattedXValue());
            sb.append(" Y: ").append(seriesInfo.getFormattedYValue());
            setText(sb);

            setTooltipBackgroundColor(0xff4781ed);
            setTooltipStroke(0xff4781ed);
            setTooltipTextColor(ColorUtil.White);
        }
    }
}
Then use it with your series like shown below
// Assume a fastLineRenderableSeries has been created and configured somewhere
fastLineRenderableSeries.setSeriesInfoProvider(new CustomSeriesInfoProvider());
Including/Excluding Series from CursorModifier
You can include or exclude series from being affected by the CursorModifier using the includeRenderableSeries method. Below is an example of including/excluding series from CursorModifier.
// Assume a cursorModifier has been created and configured somewhere

// To include a series in the cursorModifier hit-test
cursorModifier.includeRenderableSeries(seriesX, true);

// To exclude a series from the cursorModifier hit-test
cursorModifier.includeRenderableSeries(seriesY, false);
Note
To learn more about features available, please visit the Chart Modifier APIs article.
Note
To allow or prevent modifiers when inside a scroll view, please visit the isDisallowInterceptTouchEvent api. Example of the scroll view can be found on GitHub