SciChart Android Tutorial - Multiple Axis
So far, in our series of tutorials, all the charts have had one X-Axis and one Y-Axis.
SciChart supports unlimited, multiple X, and Y Axis on the left, right, bottom and top of the chart. You can change Axis alignment, rotate charts, mix axis (have both XAxis/YAxis on the left), horizontally or vertically stack axes. The possibilities are literally endless!
In this tutorial, we are going to:
- add a second
Y-Axisto the chart. - show how to register annotations and line series on the second axis.
- ensure Axis drag behaviors work on both axis.
Getting Started
This tutorial is suitable for Java and Kotlin.
Note
Source code for this tutorial can be found at our Github Repository: Java and Kotlin Tutorials Repository
First of all, make sure, you've went through the previous the tutorials:
And have at least basic understanding of how to use SciChart.
Also, you might want to read our documentation about Axis APIs.
Adding a Second Y-Axis
The procedure to add a second axis to a SciChartSurface is pretty much the same as with one axis with one difference. You must assign a unique string ID to all axes if there is more than one.
To see the axis to appear to the either side of a chart, you set AxisAlignment to e.g.:
- AxisAlignment.Left
- AxisAlignment.Right
- etc...
Let's add another axis and align it to the left side of the chart (assuming the original one is placed to the right).
To have a different scale on the secondary axis, we are going to enlarge its VisibleRange by 40% setting a growBy value:
// Create another numeric axis, right-aligned
final IAxis yAxisRight = new NumericAxis(this);
yAxisRight.setAxisTitle("Primary Y-Axis");
yAxisRight.setAxisId("Primary Y-Axis");
yAxisRight.setAxisAlignment(AxisAlignment.Right);

// Create another numeric axis, left-aligned
final IAxis yAxisLeft = new NumericAxis(this);
yAxisLeft.setAxisTitle("Secondary Y-Axis");
yAxisLeft.setAxisId("Secondary Y-Axis");
yAxisLeft.setAxisAlignment(AxisAlignment.Left);
yAxisLeft.setGrowBy(new DoubleRange(0.2, 0.2));
Collections.addAll(surface.getXAxes(), new NumericAxis(this));
Collections.addAll(surface.getYAxes(), yAxisLeft, yAxisRight);
Now we can see the second axis in our application:
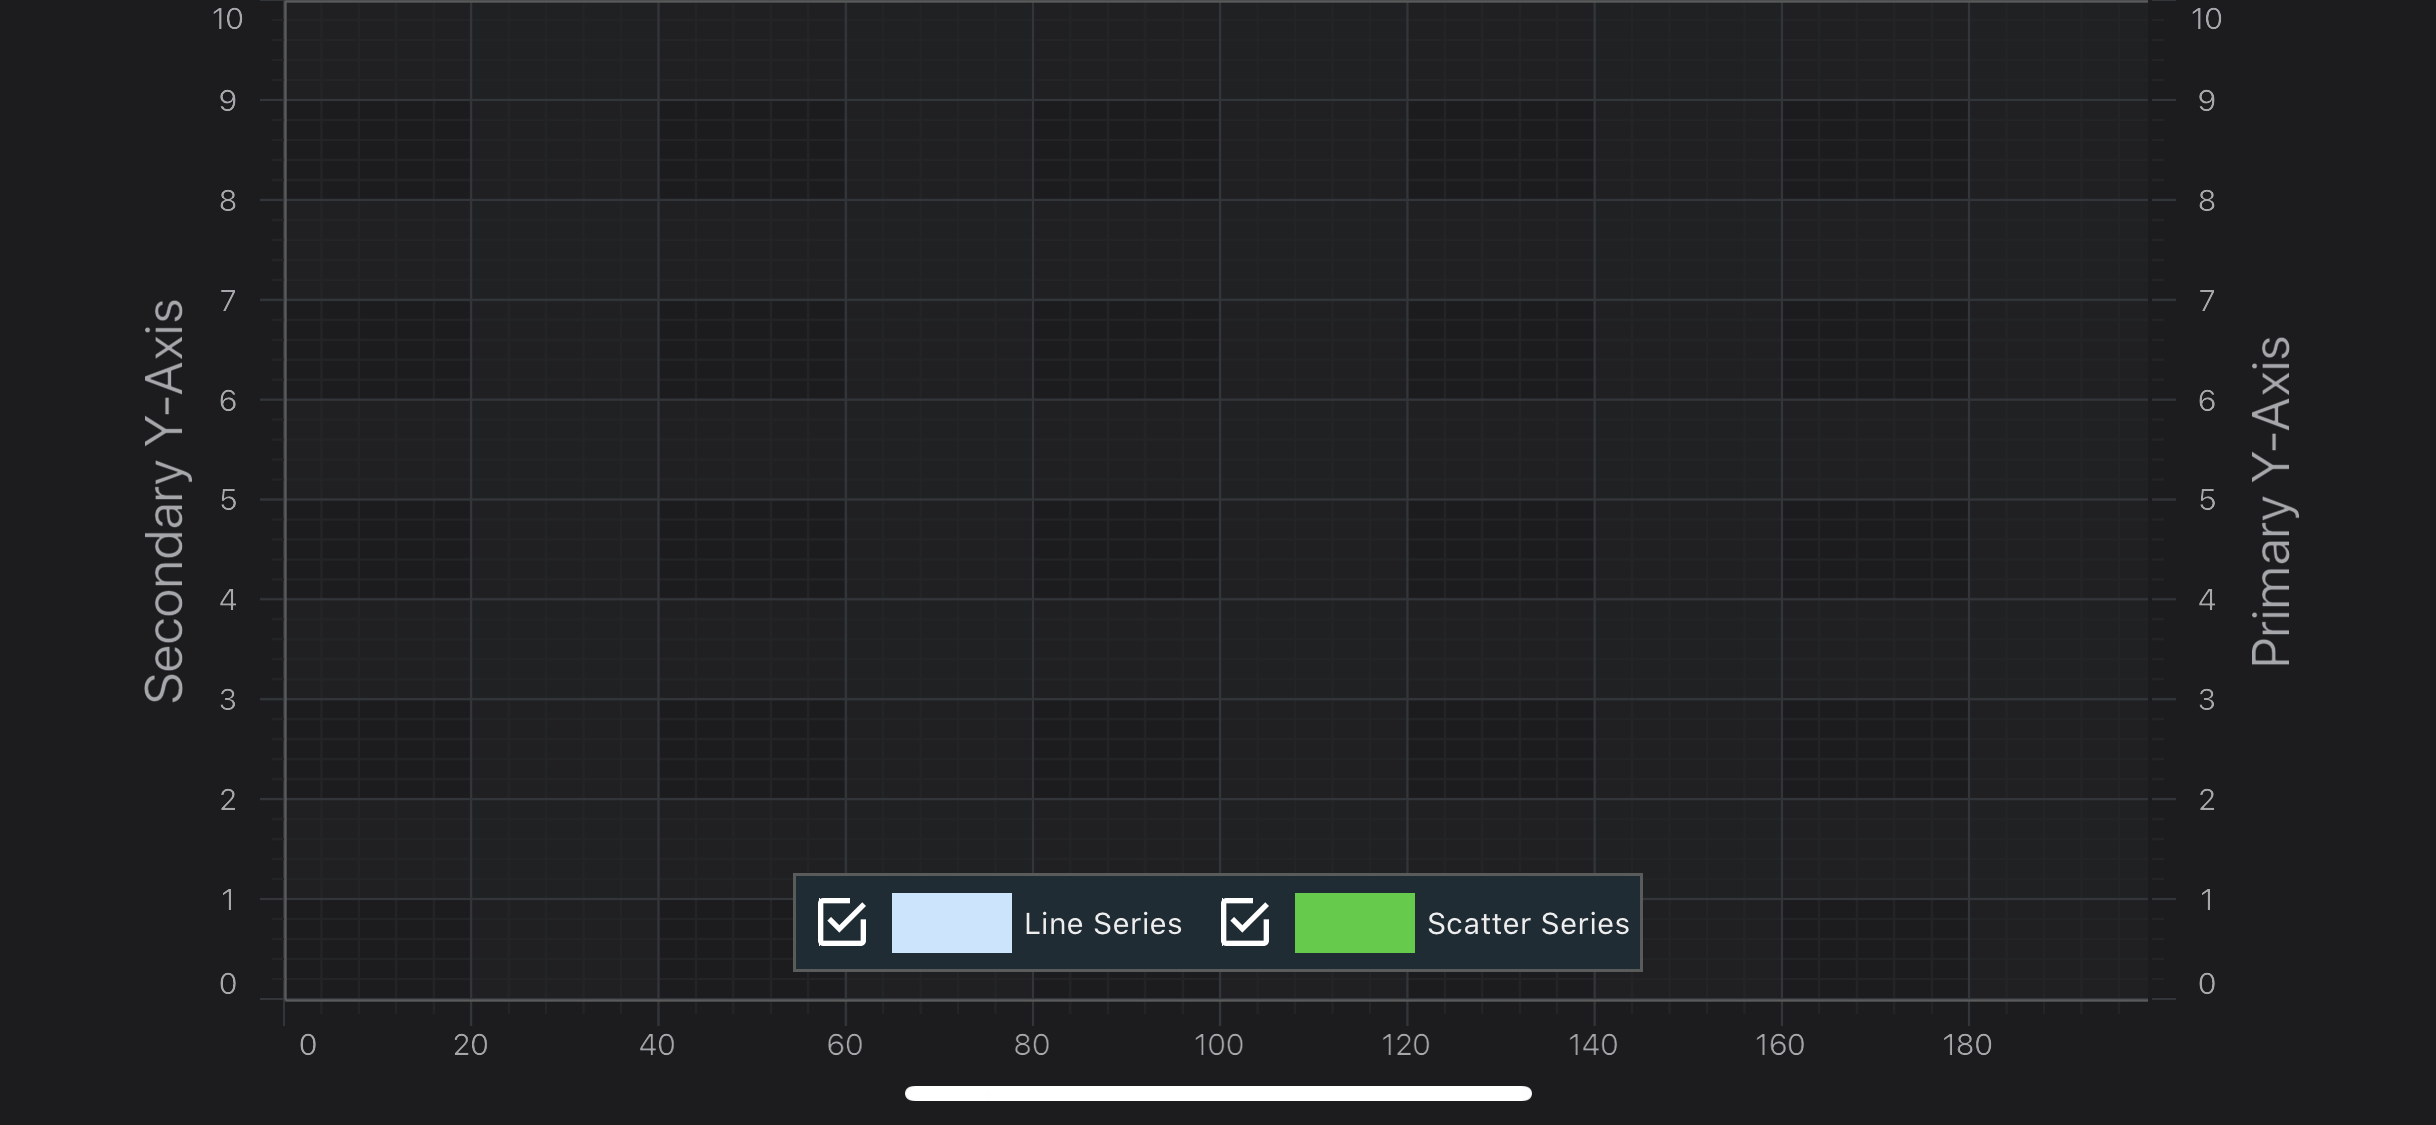
Note
Annotations and RenderableSeries don't get rendered now
Registering RenderableSeries on the Second Y-Axis
If there are several Y or X axes, you need to register other chart parts, like RenderableSeries and Annotations, on a particular axis to be measured against its scale.
From the tutorial, we are going to attach one series to the right axis and the other to the left axis, passing corresponding IDs to the RenderableSeries:
final IRenderableSeries lineSeries = new FastLineRenderableSeries();
lineSeries.setYAxisId("Primary Y-Axis");
final IRenderableSeries scatterSeries = new XyScatterRenderableSeries();
scatterSeries.setYAxisId("Secondary Y-Axis");
Which results in the following:
Registering Annotations on the Second Y-Axis
Annotations also need to be registered on a certain axis in a multi-axis scenario. So we are going to alternate the axis IDs to annotations in on our chart for the left or right axes in the following way:
final TextAnnotation label = new TextAnnotation(this);
label.setYAxisId(x % 200 == 0 ? "Primary Y-Axis" : "Secondary Y-Axis");
If you now add YAxisDragModifier you can see which series and annotation are registered on which Y-Axis:
Collections.addAll(surface.getChartModifiers(), new YAxisDragModifier());
Where to Go From Here?
You can download the final project from our Java and Kotlin Tutorials Repository.
Also, you can found next tutorial from this series here - SciChart Android Tutorial - Linking Multiple Charts
Of course, this is not the limit of what you can achieve with the SciChart Android. You might want to read some of the following articles:
Finally, start exploring. The SciChart Android library and functionality is quite extensive. You can look into our SciChart Android Examples Suite which are full of 2D and 3D examples, which are also available on our GitHub