Search Results for

    Show / Hide Table of Contents

    SciChart Android Tutorial - Linking Multiple Charts

    In our series of tutorials, up until now we have added a chart with two Y-Axis, one X-Axis, two series, added tooltips, legends and zooming, panning behavior, and added some annotations. All of that was with the only SciChartSurface.

    In SciChart, there is no restriction on the number of SciChartSurface you can have in an application.

    In the previous tutorial - Multiple Axis - we've manipulated one SciChartSurface instance. In this tutorial you will learn how to:

    • add a second SciChartSurface (or potentially unlimited surfaces).
    • link multiple charts and modifiers on them together

    Getting Started

    This tutorial is suitable for Java and Kotlin.

    Note

    Source code for this tutorial can be found at our Github Repository: Java and Kotlin Tutorials Repository

    First of all, make sure, you've went through the previous the tutorials, to have a better grasp of SciChart functionality, such as:

    • Tutorial 01 - Create a simple Chart 2D
    • Tutorial 05 - Annotations
    • Tutorial 06 - Multiple Axis

    Adding a Second Chart

    Assuming, you've already know how to add one SciChartSurface, it should be fairly easy to add second surface. Just repeat the same procedure to configure the second chart. We will leave off annotations and modifiers. Everything else will be the same.

    The code below shows how to add two SciChartSurface instance into one view:

    • Java
    • Java with Builders API
    • Kotlin
    • Xamarin.Android
    surface = new SciChartSurface(this);
    surface2 = new SciChartSurface(this);
    chartLayout.addView(surface);
    chartLayout.addView(surface2);
    
    // Set layout parameters for both surfaces
    final LinearLayout.LayoutParams layoutParams = new LinearLayout.LayoutParams(
            LinearLayout.LayoutParams.MATCH_PARENT,
            LinearLayout.LayoutParams.MATCH_PARENT,
            1.0f
    );
    surface.setLayoutParams(layoutParams);
    surface2.setLayoutParams(layoutParams);
    
    surface = SciChartSurface(this)
    surface2 = SciChartSurface(this)
    chartLayout.addView(surface)
    chartLayout.addView(surface2)
    
    // Set layout parameters for both surfaces
    val layoutParams = LinearLayout.LayoutParams(
        LinearLayout.LayoutParams.MATCH_PARENT,
        LinearLayout.LayoutParams.MATCH_PARENT,
        1.0f
    )
    surface.layoutParams = layoutParams
    surface2.layoutParams = layoutParams
    
    surface1 = new SciChartSurface(this);
    surface2 = new SciChartSurface(this);
    chartLayout.AddView(surface1);
    chartLayout.AddView(surface2);
    
    // Set layout parameters for both surfaces
    var layoutParams = new LinearLayout.LayoutParams(
        ViewGroup.LayoutParams.MatchParent,
        ViewGroup.LayoutParams.MatchParent,
        1.0f
    );
    surface1.LayoutParameters = layoutParams;
    surface2.LayoutParameters = layoutParams;
    
    Note

    You might want to add your Surfaces from the .xml or whatever else. Setting layout parameters for both surfaces in code is just for the sake of simplicity.

    Now, let's add Axes onto a Surfaces as we did before, the only difference - we extracted some code to omit duplications:

    • Java
    • Java with Builders API
    • Kotlin
    • Xamarin.Android
    private void setupSurface(SciChartSurface surface) {
        // Create another numeric axis, right-aligned
        final IAxis yAxisRight = new NumericAxis(this);
        yAxisRight.setAxisTitle("Primary Y-Axis");
        yAxisRight.setAxisId("Primary Y-Axis");
        yAxisRight.setAxisAlignment(AxisAlignment.Right);
    
        // Create another numeric axis, left-aligned
        final IAxis yAxisLeft = new NumericAxis(this);
        yAxisLeft.setAxisTitle("Secondary Y-Axis");
        yAxisLeft.setAxisId("Secondary Y-Axis");
        yAxisLeft.setAxisAlignment(AxisAlignment.Left);
        yAxisLeft.setGrowBy(new DoubleRange(0.2, 0.2));
    
        final RolloverModifier rolloverModifier = new RolloverModifier();
        rolloverModifier.setReceiveHandledEvents(true);
        rolloverModifier.setEventsGroupTag("SharedEventGroup");
    
        UpdateSuspender.using(surface, () -> {
            Collections.addAll(surface.getXAxes(), new NumericAxis(this));
            Collections.addAll(surface.getYAxes(), yAxisLeft, yAxisRight);
            Collections.addAll(surface.getChartModifiers(),
                    new ZoomExtentsModifier(),
                    new PinchZoomModifier(),
                    rolloverModifier,
                    new XAxisDragModifier(),
                    new YAxisDragModifier());
        });
    }
    
    setupSurface(surface);
    setupSurface(surface2);
    
    private void setupSurface(SciChartSurface surface) {
        // Create another numeric axis, right-aligned
        final IAxis yAxisRight = sciChartBuilder.newNumericAxis()
                .withAxisTitle("Primary Y-Axis")
                .withAxisId("Primary Y-Axis")
                .withAxisAlignment(AxisAlignment.Right)
                .build();
    
        // Create another numeric axis, left-aligned
        final IAxis yAxisLeft = sciChartBuilder.newNumericAxis()
                .withAxisTitle("Secondary Y-Axis")
                .withAxisId("Secondary Y-Axis")
                .withAxisAlignment(AxisAlignment.Left)
                .withGrowBy(new DoubleRange(0.2, 0.2))
                .build();
    
        ModifierGroup rolloverModifier = sciChartBuilder.newModifierGroup()
                .withRolloverModifier()
                .build()
                .withReceiveHandledEvents(true)
                .withMotionEventsGroup("SharedEventGroup")
                .build();
    
        UpdateSuspender.using(surface, () -> {
            Collections.addAll(surface.getXAxes(), new NumericAxis(this));
            Collections.addAll(surface.getYAxes(), yAxisLeft, yAxisRight);
            Collections.addAll(surface.getChartModifiers(),
                    new ZoomExtentsModifier(),
                    new PinchZoomModifier(),
                    rolloverModifier,
                    new XAxisDragModifier(),
                    new YAxisDragModifier());
        });
    }
    
    setupSurface(surface);
    setupSurface(surface2);
    
    private fun setupSurface(surface: SciChartSurface) {
        // Create another numeric axis, right-aligned
        val yAxisRight = NumericAxis(this)
        yAxisRight.axisTitle = "Primary Y-Axis"
        yAxisRight.axisId = "Primary Y-Axis"
        yAxisRight.axisAlignment = AxisAlignment.Right
    
        // Create another numeric axis, left-aligned
        val yAxisLeft = NumericAxis(this)
        yAxisLeft.axisTitle = "Secondary Y-Axis"
        yAxisLeft.axisId = "Secondary Y-Axis"
        yAxisLeft.axisAlignment = AxisAlignment.Left
        yAxisLeft.growBy = DoubleRange(0.2, 0.2)
    
        val rolloverModifier = RolloverModifier()
        rolloverModifier.receiveHandledEvents = true
        rolloverModifier.eventsGroupTag = "SharedEventGroup"
    
        UpdateSuspender.using(surface) {
            Collections.addAll(surface.xAxes, NumericAxis(this))
            Collections.addAll(surface.yAxes, yAxisLeft, yAxisRight)
            Collections.addAll(
                surface.chartModifiers,
                ZoomExtentsModifier(),
                PinchZoomModifier(),
                rolloverModifier,
                XAxisDragModifier(),
                YAxisDragModifier()
            )
        }
    }
    
    setupSurface(surface)
    setupSurface(surface2)
    
    private void SetupSurface(SciChartSurface surface)
    {
        var yAxisRight = new NumericAxis(this)
        {
            AxisTitle = "Primary Y-Axis",
            AxisId = "Primary Y-Axis",
            AxisAlignment = AxisAlignment.Right
        };
    
        // Create another numeric axis, left-aligned
        var yAxisLeft = new NumericAxis(this)
        {
            AxisTitle = "Secondary Y-Axis",
            AxisId = "Secondary Y-Axis",
            AxisAlignment = AxisAlignment.Left,
            GrowBy = new DoubleRange(0.2, 0.2)
        };
    
        var rolloverModifier = new RolloverModifier() 
        {
            ReceiveHandledEvents = true,
            EventsGroupTag = "SharedEventGroup"
        };
    
        using (surface.SuspendUpdates())
        {
            surface.XAxes.Add(new NumericAxis(this));
            surface.YAxes.Add(yAxisLeft);
            surface.YAxes.Add(yAxisRight);
    
            surface.ChartModifiers.Add(new ZoomExtentsModifier());
            surface.ChartModifiers.Add(new PinchZoomModifier());
            surface.ChartModifiers.Add(rolloverModifier);
    
            surface.ChartModifiers.Add(new XAxisDragModifier());
            surface.ChartModifiers.Add(new YAxisDragModifier());
        }
    }
    
    SetupSurface(surface1);
    SetupSurface(surface2);
    

    At this stage, you should have something similar to the shown below:

    Multi Chart Empty

    Adding a Series to the Second Chart

    Now we are ready to add a RenderableSeries to the second chart. To try something new, let's add a Mountain Series

    We are going to attach an existing DataSeries instance, so it scrolls just like the series on the first chart. Also, we will attach the RenderableSeries to the right axis.

    Note

    Remember, since there are two Y-Axes, they both must have unique IDs assigned to them. Those IDs can be used to register RenderableSeries and Annotations on a corresponding axis.

    So just add these lines of code:

    • Java
    • Java with Builders API
    • Kotlin
    • Xamarin.Android
    final FastMountainRenderableSeries mountainSeries = new FastMountainRenderableSeries();
    mountainSeries.setYAxisId("Primary Y-Axis");
    mountainSeries.setDataSeries(mountainDataSeries);
    mountainSeries.setStrokeStyle(new SolidPenStyle(0xFF0271B1, false, 1.0f, null));
    mountainSeries.setAreaStyle( new SolidBrushStyle(0xAAFF8D42));
    
    UpdateSuspender.using(surface2, () -> {
        Collections.addAll(surface2.getRenderableSeries(), mountainSeries);
    });
    
    final FastMountainRenderableSeries mountainSeries = sciChartBuilder.newMountainSeries()
            .withYAxisId("Primary Y-Axis")
            .withDataSeries(mountainDataSeries)
            .withStrokeStyle(new SolidPenStyle(0xFF0271B1, false, 1.0f, null))
            .withAreaFillColor(0xAAFF8D42)
            .build();
    
    UpdateSuspender.using(surface2, () -> {
        Collections.addAll(surface2.getRenderableSeries(), mountainSeries);
    });
    
    val mountainSeries = FastMountainRenderableSeries()
    mountainSeries.yAxisId = "Primary Y-Axis"
    mountainSeries.dataSeries = mountainDataSeries
    mountainSeries.strokeStyle = SolidPenStyle(0xFF0271B1.toInt(), false, 1.0f, null)
    mountainSeries.areaStyle = SolidBrushStyle(0xAAFF8D42.toInt())
    
    UpdateSuspender.using(surface2) {
        Collections.addAll(surface2.renderableSeries, mountainSeries)
    }
    
    var mountainSeries = new FastMountainRenderableSeries() 
    {
        YAxisId = "Primary Y-Axis",
        DataSeries = mountainDataSeries,
        StrokeStyle = new SolidPenStyle(0xFF0271B1, 1.0f, false, null),
        AreaStyle = new SolidBrushStyle(0xAAFF8D42)
    };
    
    using (surface2.SuspendUpdates())
    {
        surface2.RenderableSeries.Add(mountainSeries);
    }
    

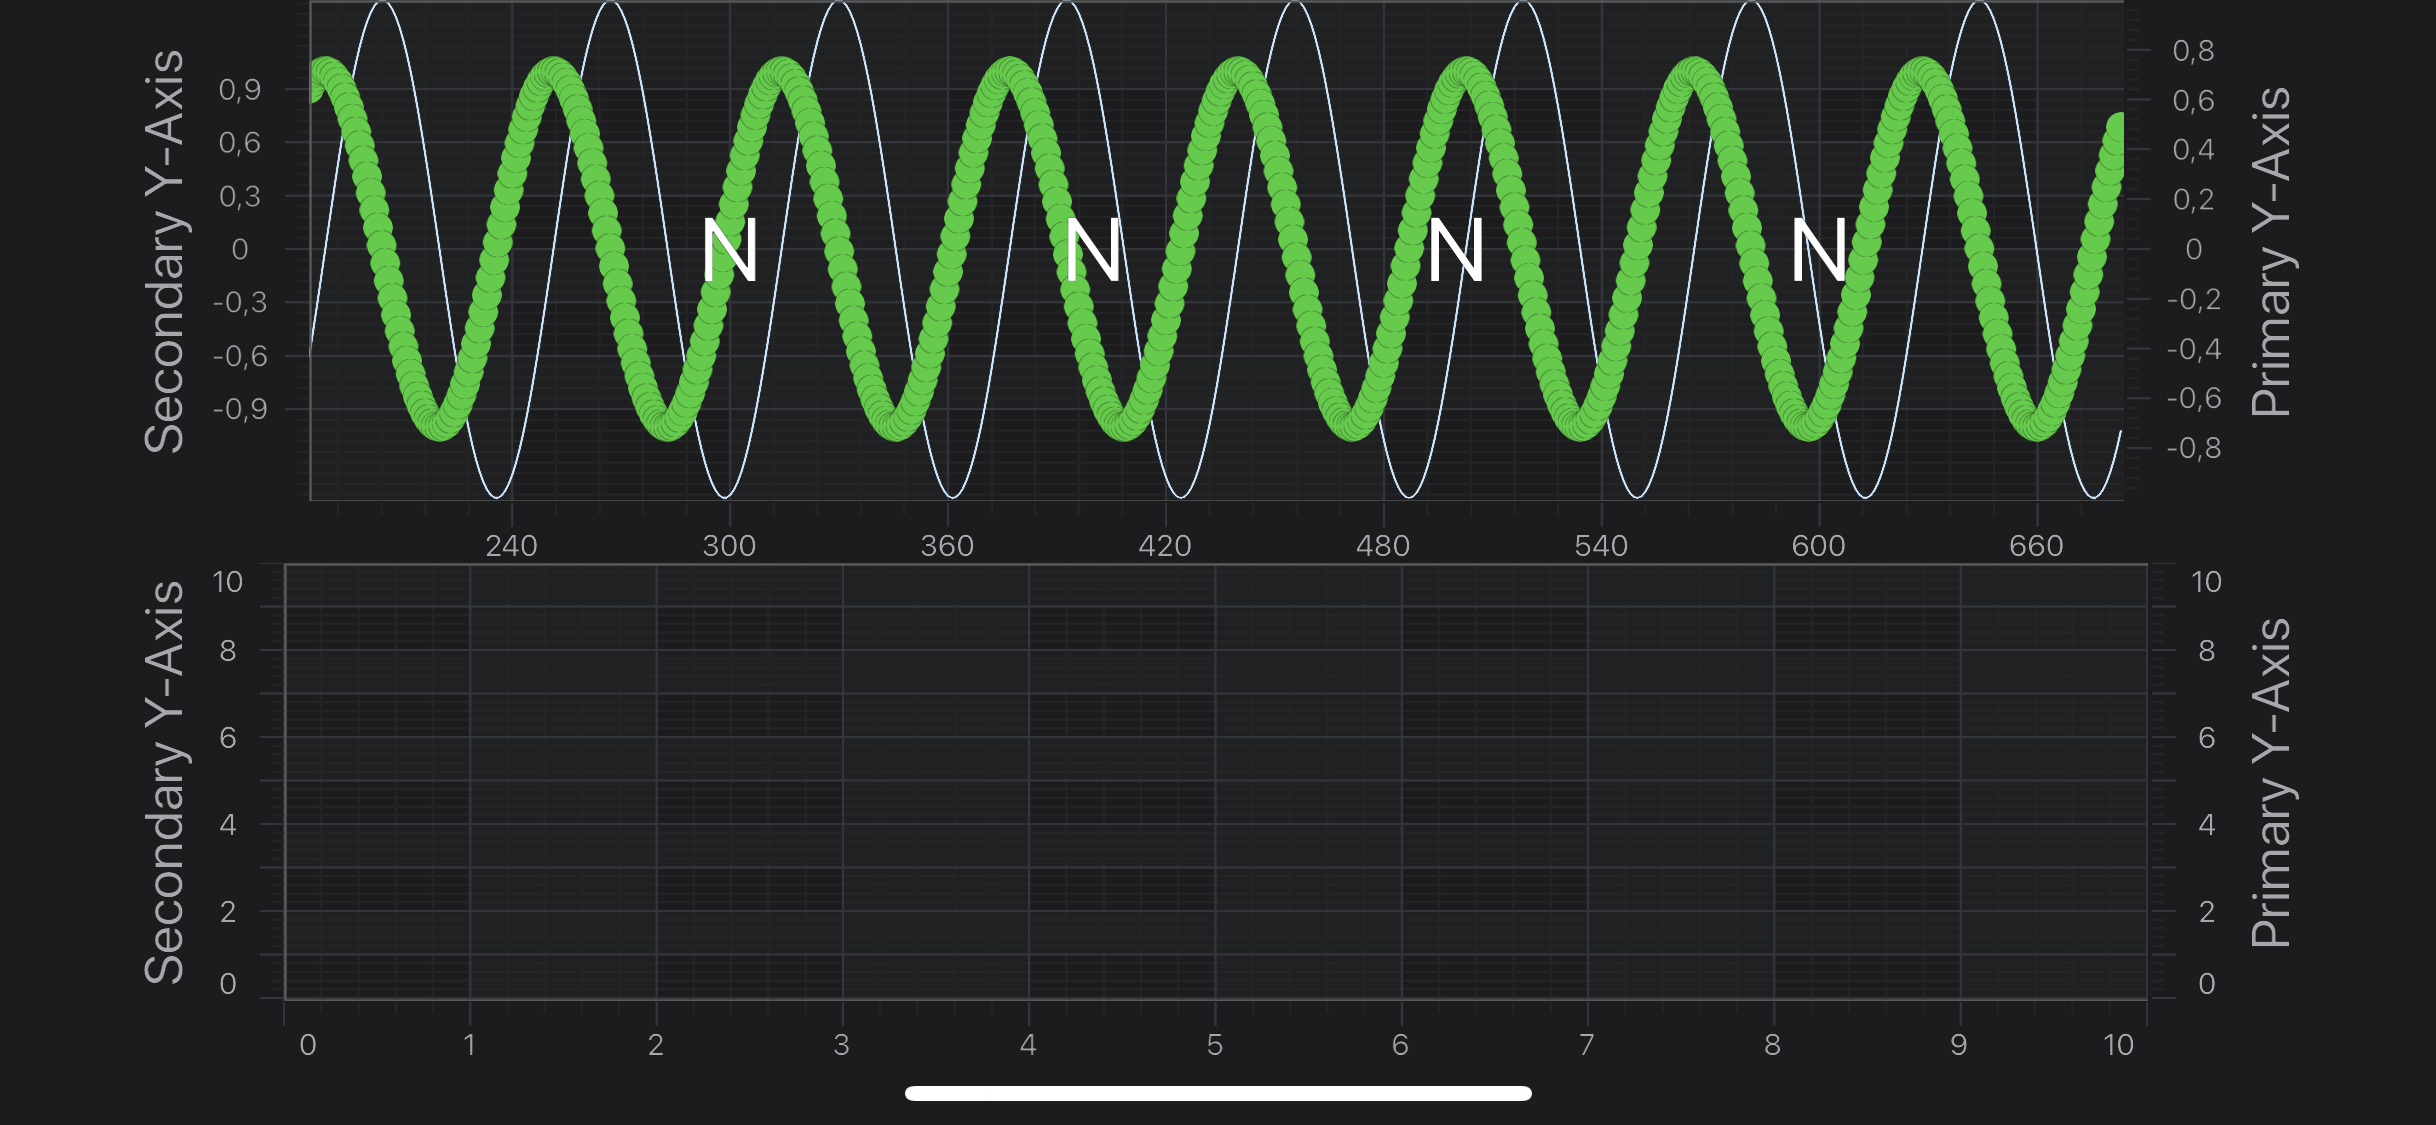
    Now you should see something like this:

    ![Multi Chart](images/tutorials-2d-multi-chart.mp4">

    Synchronizing Multiple Charts

    In SciChart, you can synchronize VisibleRanges, chart Sizes, Modifiers, tooltips and more!

    Synchronizing VisibleRanges on Axes

    To make both charts show the same VisibleRanges on both axes, you share the same IRange<T> instance across the axes.

    In this particular case, there is no need to do that because both charts use the same data. But if it was different, we would need to synchronize VisibleRanges like this:

    • Java
    • Java with Builders API
    • Kotlin
    • Xamarin.Android
    final DoubleRange sharedXRange = new DoubleRange();
    
    // Create an X axis and apply sharedXRange
    final NumericAxis xAxis = new NumericAxis(this);
    xAxis.setVisibleRange(sharedXRange);
    
    // Create another X axis and apply sharedXRange
    final NumericAxis xAxis2 = new NumericAxis(this);
    xAxis2.setVisibleRange(sharedXRange);
    
    final DoubleRange sharedXRange = new DoubleRange();
    
    // Create an X axis and apply sharedXRange
    final NumericAxis xAxis = sciChartBuilder.newNumericAxis()
            .withVisibleRange(sharedXRange)
            .build();
    
    // Create another X axis and apply sharedXRange
    final NumericAxis xAxis2 = sciChartBuilder.newNumericAxis()
            .withVisibleRange(sharedXRange)
            .build();
    
    // Create an IRange instance that will be shared across multiple charts
    val sharedXRange = DoubleRange()
    
    // Create an X axis and apply sharedXRange
    val xAxis = NumericAxis(this)
    xAxis.visibleRange = sharedXRange
    
    // Create another X axis and apply sharedXRange
    val xAxis2 = NumericAxis(this)
    xAxis2.visibleRange = sharedXRange
    
    // Create an IRange instance that will be shared across multiple charts
    var sharedXRange = new DoubleRange();
    
    // Create an X axis and apply sharedXRange
    var xAxis1 = new NumericAxis(this) { VisibleRange = sharedXRange };
    // Create another X axis and apply sharedXRange
    var xAxis2 = new NumericAxis(this) { VisibleRange = sharedXRange };
    

    Synchronizing Chart Widths

    Imagine a situation when you have a two charts with Y axes on opposite sides, or values on your Y-Axes differs, and width of them are different. It will cause one of the chart areas stick out. There is a helper class called SciChartVerticalGroup which is used in situations like this. It's just line charts up. See the code below which showcases how to use it:

    • Java
    • Java with Builders API
    • Kotlin
    • Xamarin.Android
    final SciChartVerticalGroup verticalGroup = new SciChartVerticalGroup();
    verticalGroup.addSurfaceToGroup(surface);
    verticalGroup.addSurfaceToGroup(surface2);
    
    final SciChartVerticalGroup verticalGroup = new SciChartVerticalGroup();
    verticalGroup.addSurfaceToGroup(surface);
    verticalGroup.addSurfaceToGroup(surface2);
    
    val verticalGroup = SciChartVerticalGroup()
    verticalGroup.addSurfaceToGroup(surface)
    verticalGroup.addSurfaceToGroup(surface2)
    
    var verticalGroup = new SciChartVerticalGroup();
    verticalGroup.AddSurfaceToGroup(surface1);
    verticalGroup.AddSurfaceToGroup(surface2);
    

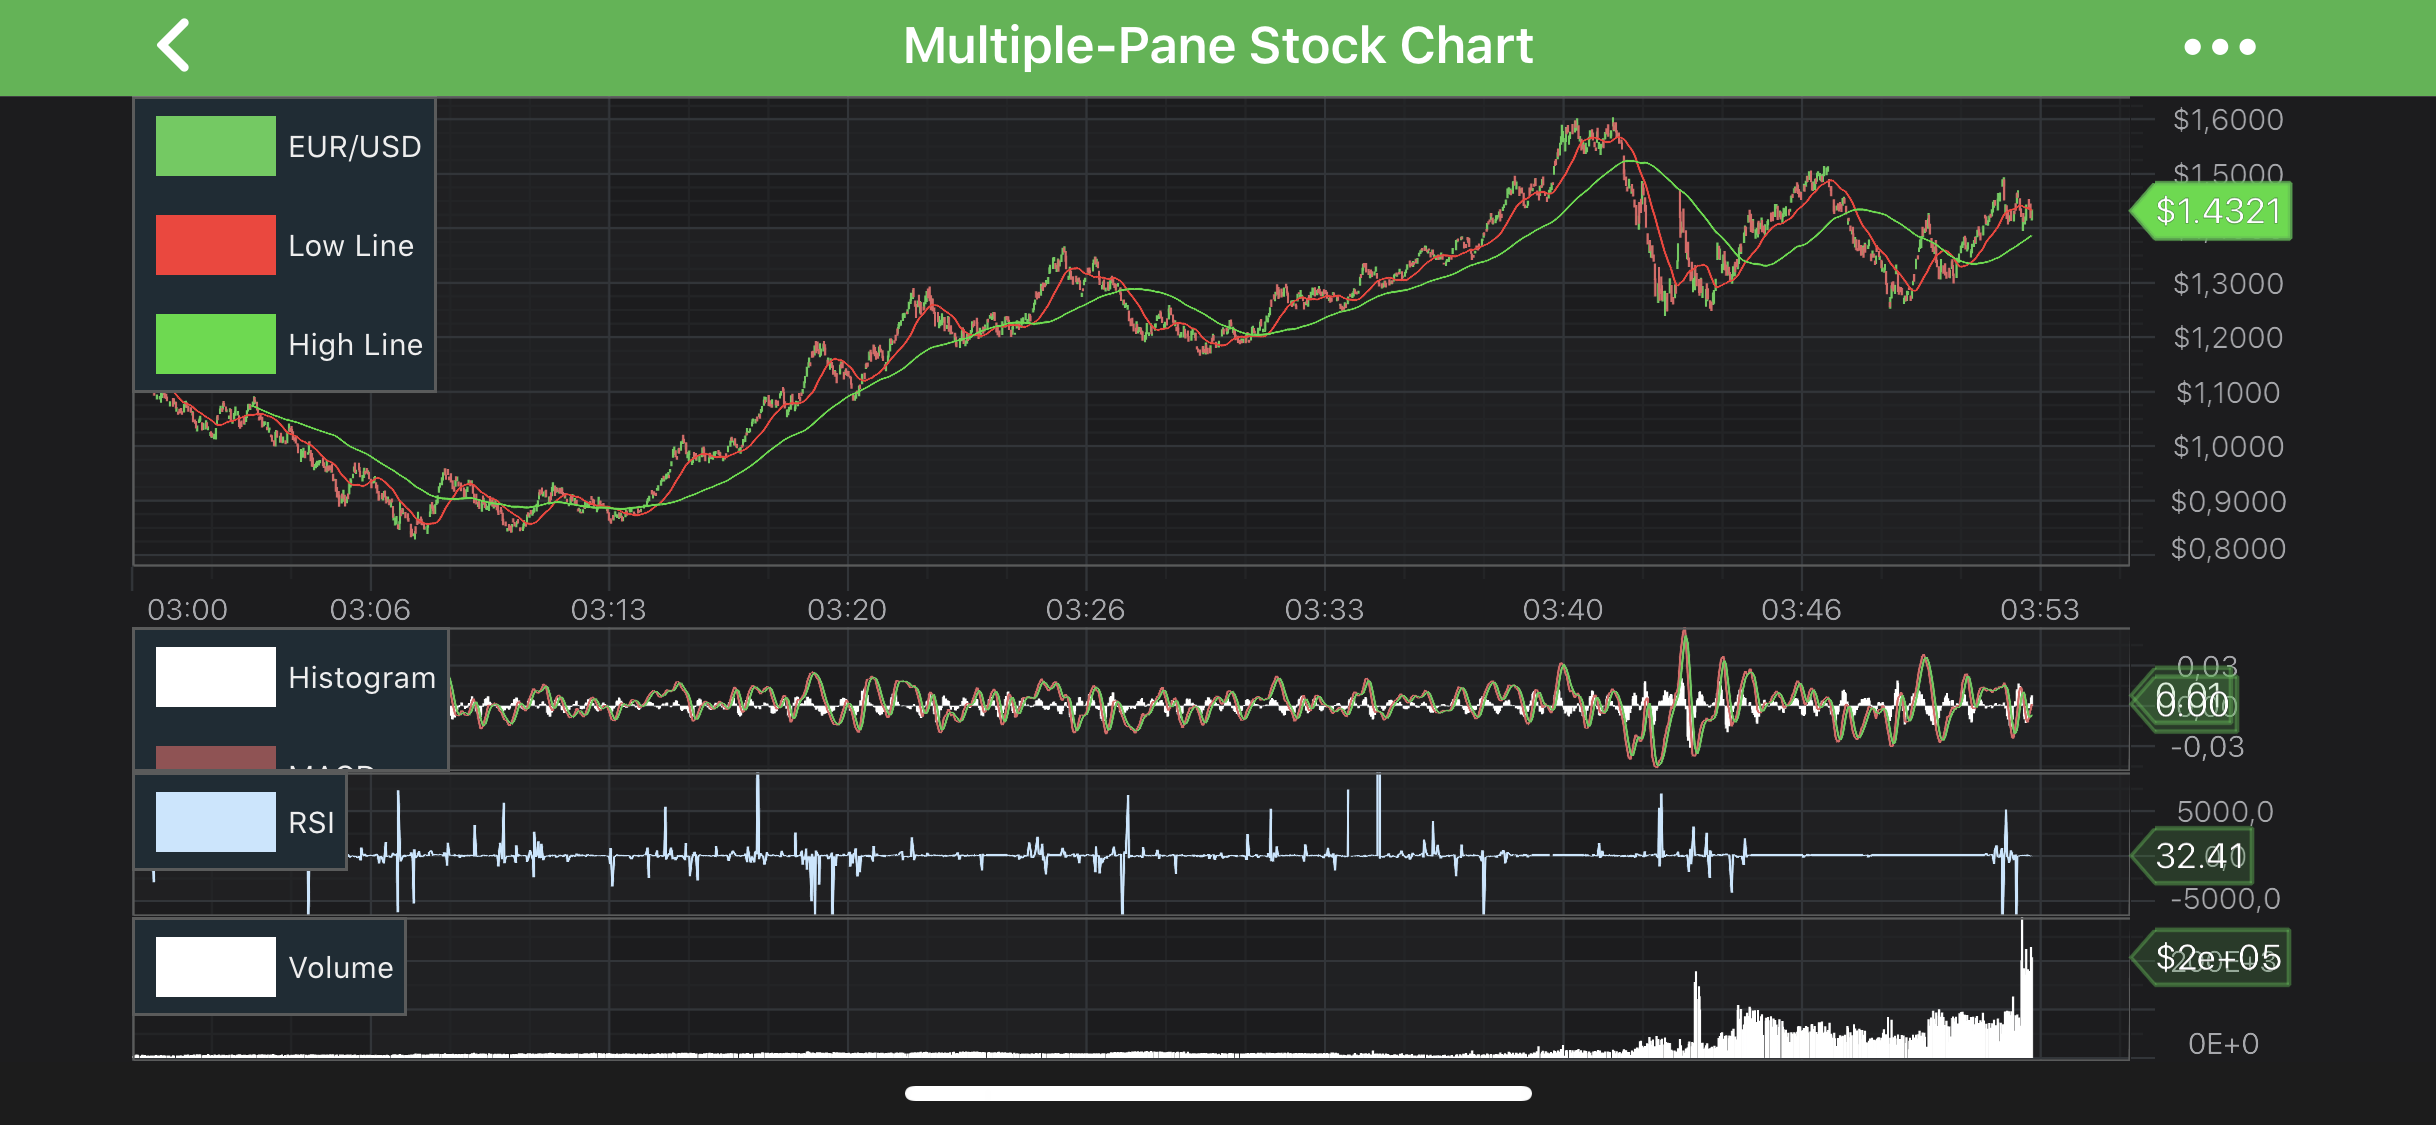
    We used this technique in our Multi-Pane Stock Chart example, which can be found in the SciChart Android Examples Suite as well as on GitHub:

    • Native Example
    • Xamarin Example

    Multi Pane Stock Charts

    Multi-Pane Stock Chart

    Linking Cursor and Other Modifiers

    Next we are going to link chart modifiers.

    The first chart has an array of ChartModifiers set up to handle zooming, panning and tooltips. We are going to add some of these modifiers to the second chart.

    To sync those modifier, you should add the modifiers through the ModifierGroup collection, and share the same group via the motionEventGroup property, like showcased below:

    • Java
    • Java with Builders API
    • Kotlin
    • Xamarin.Android
    final ModifierGroup modifierGroup = new ModifierGroup();
    modifierGroup.setMotionEventGroup("SharedEventGroup");
    modifierGroup.setReceiveHandledEvents(true);
    Collections.addAll(modifierGroup.getChildModifiers(),
            new ZoomExtentsModifier(),
            new PinchZoomModifier(),
            rolloverModifier,
            new XAxisDragModifier(),
            new YAxisDragModifier());
    
    final ModifierGroup modifierGroup = sciChartBuilder.newModifierGroup()
            .withMotionEventsGroup("SharedEventGroup")
            .withReceiveHandledEvents(true)
            .build();
    
    Collections.addAll(modifierGroup.getChildModifiers(),
            new ZoomExtentsModifier(),
            new PinchZoomModifier(),
            rolloverModifier,
            new XAxisDragModifier(),
            new YAxisDragModifier());
    
    val modifierGroup = ModifierGroup()
    modifierGroup.motionEventGroup = "SharedEventGroup"
    modifierGroup.receiveHandledEvents = true
    Collections.addAll(
        modifierGroup.childModifiers,
        ZoomExtentsModifier(),
        PinchZoomModifier(),
        rolloverModifier,
        XAxisDragModifier(),
        YAxisDragModifier()
    )
    
    var modifierGroup = new ModifierGroup()
    {
        MotionEventGroup = "SharedEventGroup",
        ReceiveHandledEvents = true 
    };
    modifierGroup.ChildModifiers.Add(new ZoomExtentsModifier());
    modifierGroup.ChildModifiers.Add(new PinchZoomModifier());
    modifierGroup.ChildModifiers.Add(rolloverModifier);
    modifierGroup.ChildModifiers.Add(new XAxisDragModifier());
    modifierGroup.ChildModifiers.Add(new YAxisDragModifier());
    
    Note

    You can use a motionEventGroup on more than two charts.

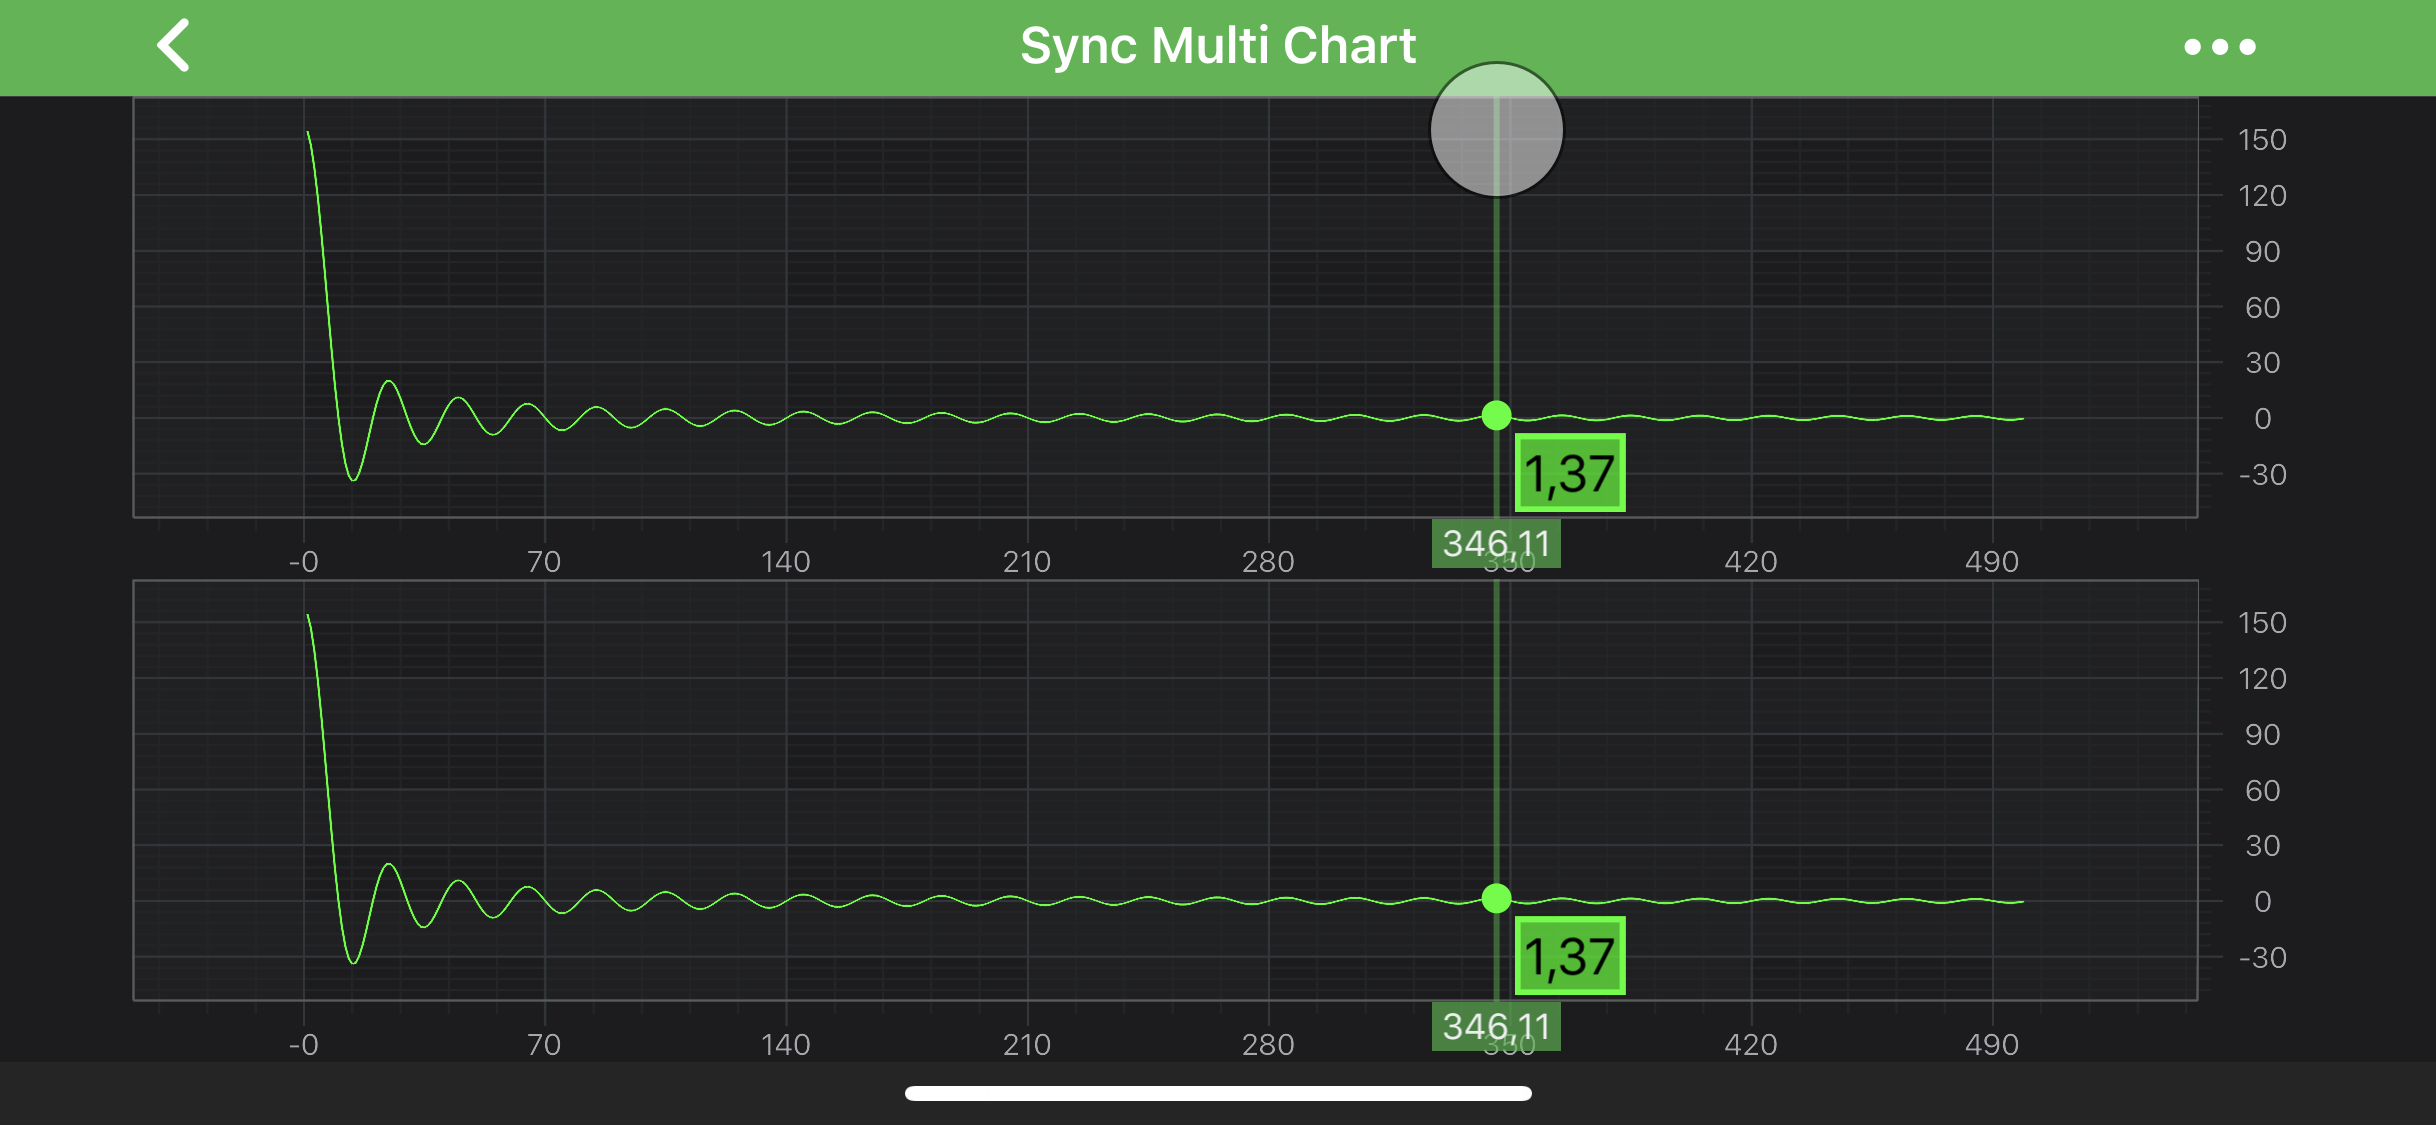
    Run the application again. The Cursors and Tooltips are now synchronized across the charts:

    Where to Go From Here?

    You can download the final project from our Java and Kotlin Tutorials Repository.

    Of course, this is not the limit of what you can achieve with the SciChart Android. You might want to read some of the following articles:

    • Axis APIs
    • Annotations API
    • 2D Chart Types
    • Chart Modifiers

    Finally, start exploring. The SciChart Android library and functionality is quite extensive. You can look into our SciChart Android Examples Suite which are full of 2D and 3D examples, which are also available on our GitHub

    For instance - take a look at our Sync Multi Chart example, which can be found in the SciChart Android Examples Suite as well as on GitHub:

    • Native Example

    Sync Multi Chart Example

    Back to top © 2011-2025 SciChart. All rights reserved. | sitemap.xml