
All Axis Types include the AxisCore.labelProvider property, which formats axis and cursor labels. Built in to SciChart.js are a number of labelProvider types, and you can even create your own.
The inheritence diagram for LabelProviders in SciChart.js looks like this:
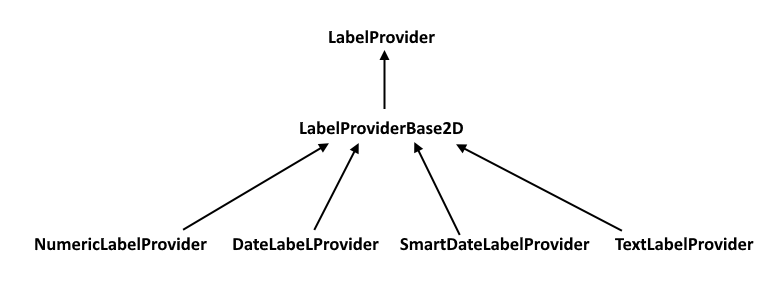
All of these classes inherit LabelProviderBase2D. Below there is a mapping between which axis type has which labelprovider:
| Axis Type | ... Has LabelProvider type |
| NumericAxis | NumericLabelProvider |
| DateTimeNumericAxis | SmartDateLabelProvider |
| CategoryAxis | DateLabelProvider |
| LogarithmicAxis | LogarithmicLabelProvider |
We've included examples of how to format labels via the built-in label providers in the above articles. Click on 'NumericAxis' or 'DateTimeNumericAxis' above for more info and a code sample.
Applying a LabelProvider to an axis
All axis (above) have a built-in LabelProvider. You can also apply a labelprovider to an axis with the following code:
| SmartDate Formatting Example |
Copy Code
|
|---|---|
import { CategoryAxis, SmartDateLabelProvider  } from "scichart";
sciChartSurface.xAxes.add(new CategoryAxis(wasmContext, {
             labelProvider: new SmartDateLabelProvider()
}));
|
|
If you have an axis where the date range can change as the user zooms, the SmartDateLabelProvider provides dynamic date labels which automatically adjust based on the axis range. You can also create custom dynamic labelproviders. See the rest of this article for steps how to do this.
LabelProvider & LabelProviderBase2D
These are the base classes for all labelproviders in SciChart.js. Some of the properties they include can be found below.
The properties common to the LabelProviderBase2D / LabelProvider classes can be found in the TypeDoc API documentation.
Properties
- async
Labels - format
Cursor Label Property - format
Label Property - parent
Axis - provider
Id - style
Id - text
Varies For Same Tick - tick
ToText - type
- use
Cache - use
Native Text - use
Shared Cache
Accessors
- cursor
Numeric Format - cursor
Precision - format
Cursor Label - format
Label - line
Spacing - numeric
Format - postfix
- precision
- prefix
- rotation
Methods
- apply
Format - attached
ToAxis - clear
Cache - delete
- get
Cached Label Texture - get
Cached Style - get
Label Height - get
Label Sizes Native - get
Label Texture - get
Label Texture Async - get
Label Width - get
Labels - get
Max Label Height For Horizontal Axis - get
Max Label Width For Vertical Axis - get
Native Label Info - invalidate
Parent - on
Begin Axis Draw - toJSON
There are many options to format axis labels in SciChart.js via the labelProvider. Above is a list of the common properties and functions on the base class.
In particular:
SciChart.js calls axis.labelProvider.formatLabel(dataValue) to format each label on the axis and axis.labelProvider.formatCursorLabel(dataValue) to format each cursor label.
The built-in implementation of formatLabel provides text formatting based on the labelProvider.numericFormat & labelProvider.cursorNumericFormat properties.
The number of decimal places (if applicable numericFormat is chosen) is specified by labelProvider.precision property.
A string prefix and postfix are provided by the labelProvider.prefix and labelProvider.postFix properties.
A rotation angle may be specified by labelProvider.rotation.
Caching and native text (WebGL enabled text) may be turned on or off via the labelProvider.useCache or useNativeText property.
Setting LabelProvider properties
LabelProvider properties can be set either on the labelProvider itself, or, in many cases can be set via the axis constructor options. The following code is equivalent:
This code sample configures label providers on the X & Y axis with exactly the same properties:
<div id="scichart-root" ></div>
body { margin: 0; }
#scichart-root { width: 100%; height: 100vh; }
async function labelproviderProperties(divElementId) {
const {
SciChartSurface,
NumericAxis,
SciChartJsNavyTheme,
ENumericFormat,
TextAnnotation,
ECoordinateMode,
EHorizontalAnchorPoint
} = SciChart;
// or, for npm, import { SciChartSurface, ... } from "scichart"
const addChartTitle = (sciChartSurface, titleText, subTitleText) => {
// Note: we will be improving this shortly in scichart.js v3.1
sciChartSurface.annotations.add(new TextAnnotation({
text: titleText,
x1: 0.5, y1: 0.5,
yCoordShift: -50,
xCoordinateMode: ECoordinateMode.Relative, yCoordinateMode: ECoordinateMode.Relative,
horizontalAnchorPoint: EHorizontalAnchorPoint.Center,
opacity: 0.5,
fontSize: 32,
fontWeight: "Bold",
textColor: "White",
}));
sciChartSurface.annotations.add(new TextAnnotation({
text: subTitleText,
x1: 0.5, y1: 0.5,
xCoordinateMode: ECoordinateMode.Relative, yCoordinateMode: ECoordinateMode.Relative,
horizontalAnchorPoint: EHorizontalAnchorPoint.Center,
opacity: 0.4,
fontSize: 17,
textColor: "White",
}));
};
const { wasmContext, sciChartSurface } = await SciChartSurface.create(divElementId, {
theme: new SciChartJsNavyTheme()
});
addChartTitle(sciChartSurface, "LabelProvider properties example", "Shows how to set labelProvider properties on axis");
// #region ExampleA
// Set LabelProvider Properties in axis constructor options
sciChartSurface.xAxes.add(new NumericAxis(wasmContext, {
  // Enable decision labels with 4 significant figures
  labelFormat: ENumericFormat.Decimal,
  cursorLabelFormat: ENumericFormat.Decimal,
  labelPrecision: 4,
  labelPrefix: "$",
  labelPostfix: " USD",
}));

// Alternatively, set properties on the labelProvider itself
const yAxis = new NumericAxis(wasmContext);
yAxis.labelProvider.numericFormat = ENumericFormat.Decimal;
yAxis.labelProvider.cursorNumericFormat = ENumericFormat.Decimal;
yAxis.labelProvider.precision = 4;
yAxis.labelProvider.prefix = "$";
yAxis.labelProvider.postfix = " USD";
sciChartSurface.yAxes.add(yAxis);
// #endregion
};
labelproviderProperties("scichart-root");
async function builderExample(divElementId) {
const {
chartBuilder,
EThemeProviderType,
ENumericFormat,
EAxisType
} = SciChart;
// or, for npm, import { chartBuilder, ... } from "scichart"
// #region ExampleB
const { sciChartSurface, wasmContext } = await chartBuilder.build2DChart(divElementId, {
  surface: { theme: { type: EThemeProviderType.Dark } },
  xAxes: {
    type: EAxisType.NumericAxis,
    // Setting the labelProvider properties via axis options
    options: {
      labelFormat: ENumericFormat.Decimal,
      cursorLabelFormat: ENumericFormat.Decimal,
      labelPrecision: 4,
      labelPrefix: "$",
      labelPostfix: " USD",
    }
  },
  yAxes: {
    type: EAxisType.NumericAxis,
  }
});

// Setting the labelprovider properties on the labelProvider itself
const labelProvider = sciChartSurface.yAxes.get(0).labelProvider;
labelProvider.numericFormat = ENumericFormat.Decimal;
labelProvider.cursorNumericFormat = ENumericFormat.Decimal;
labelProvider.precision = 4;
labelProvider.prefix = "$";
labelProvider.postfix = " USD";
// #endregion
};
// Uncomment this to use the builder example
//builderExample("scichart-root");
Overriding the formatLabel function
Say you wanted further customisation in the axis labels than what axis.labelProvider.numericFormat offers, you can start by overriding the formatLabel and formatCursorLabel functions.
Take a look at the code sample below:
The function formatLabel is overridden and called for each label on the xAxis. In this function we return a string format as hexadecimal to show how to customise labels even further.
<div id="scichart-root" ></div>
body { margin: 0; }
#scichart-root { width: 100%; height: 100vh; }
async function labelProviderFormatLabel(divElementId) {
const {
SciChartSurface,
NumericAxis,
SciChartJsNavyTheme,
NumberRange,
TextAnnotation,
ECoordinateMode,
EHorizontalAnchorPoint
} = SciChart;
const addChartTitle = (sciChartSurface, titleText, subTitleText) => {
// Note: we will be improving this shortly in scichart.js v3.1
sciChartSurface.annotations.add(new TextAnnotation({
text: titleText,
x1: 0.5, y1: 0.5,
yCoordShift: -50,
xCoordinateMode: ECoordinateMode.Relative, yCoordinateMode: ECoordinateMode.Relative,
horizontalAnchorPoint: EHorizontalAnchorPoint.Center,
opacity: 0.5,
fontSize: 32,
fontWeight: "Bold",
textColor: "White",
}));
sciChartSurface.annotations.add(new TextAnnotation({
text: subTitleText,
x1: 0.5, y1: 0.5,
xCoordinateMode: ECoordinateMode.Relative, yCoordinateMode: ECoordinateMode.Relative,
horizontalAnchorPoint: EHorizontalAnchorPoint.Center,
opacity: 0.4,
fontSize: 17,
textColor: "White",
}));
};
// or, for npm, import { SciChartSurface, ... } from "scichart"
const { wasmContext, sciChartSurface } = await SciChartSurface.create(divElementId, {
theme: new SciChartJsNavyTheme()
});
addChartTitle(sciChartSurface, "LabelProvider.formatLabel() example", "Override formatLabel() and return hexadecimal");
sciChartSurface.yAxes.add(new NumericAxis(wasmContext, { axisTitle: "Y Axis" }));
// #region ExampleA
// Format a label as hexadecimal by overriding formatLabel
const xAxis = new NumericAxis(wasmContext, {
  axisTitle: "X Axis with formatLabel",
  visibleRange: new NumberRange(0, 16),
  maxAutoTicks: 16,
});
xAxis.labelProvider.formatLabel = (dataValue) => {
  return "0x" + dataValue.toString(16);
}
sciChartSurface.xAxes.add(xAxis);
// #endregion
};
labelProviderFormatLabel("scichart-root");
async function builderExample(divElementId) {
const {
chartBuilder,
EThemeProviderType,
NumberRange,
EAxisType
} = SciChart;
// or, for npm, import { chartBuilder, ... } from "scichart"
// #region ExampleB
const { wasmContext, sciChartSurface } = await chartBuilder.build2DChart(divElementId, {
  surface: { theme: { type: EThemeProviderType.Dark } },
  xAxes: {
    type: EAxisType.NumericAxis,
    options: {
      axisTitle: "X Axis with formatLabel",
      visibleRange: new NumberRange(0, 16),
      maxAutoTicks: 16,
    }
  },
  yAxes: {
    type: EAxisType.NumericAxis,
  }
});

// Setting the labelprovider properties on the labelProvider itself
const labelProvider = sciChartSurface.xAxes.get(0).labelProvider;
labelProvider.formatLabel = (dataValue) => {
  return "0x" + dataValue.toString(16);
}
// #endregion
};
// Uncomment this to use the builder example
//builderExample("scichart-root");
Custom LabelProviders
See the following sections with worked examples on how to create custom label providers: