SciChart.js JavaScript 2D Charts API > Axis APIs > Axis Styling > Title, Labels, Gridlines and Axis Band Style
Title, Labels, Gridlines and Axis Band Style

An Axis is responsible for drawing its labels, title but also the gridlines facing away from it. Gridlines are subdivided into four categories:

  • Major Gridlines (aligned with labels)
  • Minor Gridlines (between labels)
  • Major Ticks (small marks, outside the axis, aligned with labels)
  • Minor Ticks (small marks, outside the axis, between labels)

In addition to this an axis has:

  • Axis Labels (positioned at every major gridline)
  • Axis Title (positioned once, central on the axis)


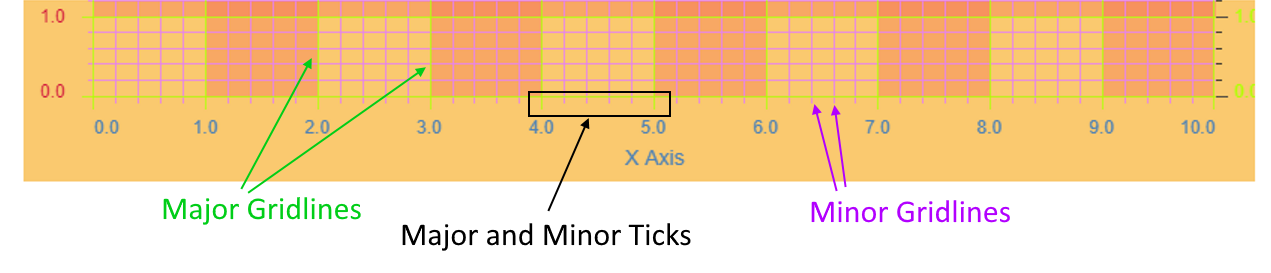
Every aspect of the axis can be styled, including major and minor gridlines, tick lines, axis labels and the title. An outline of the chart parts can be found below:

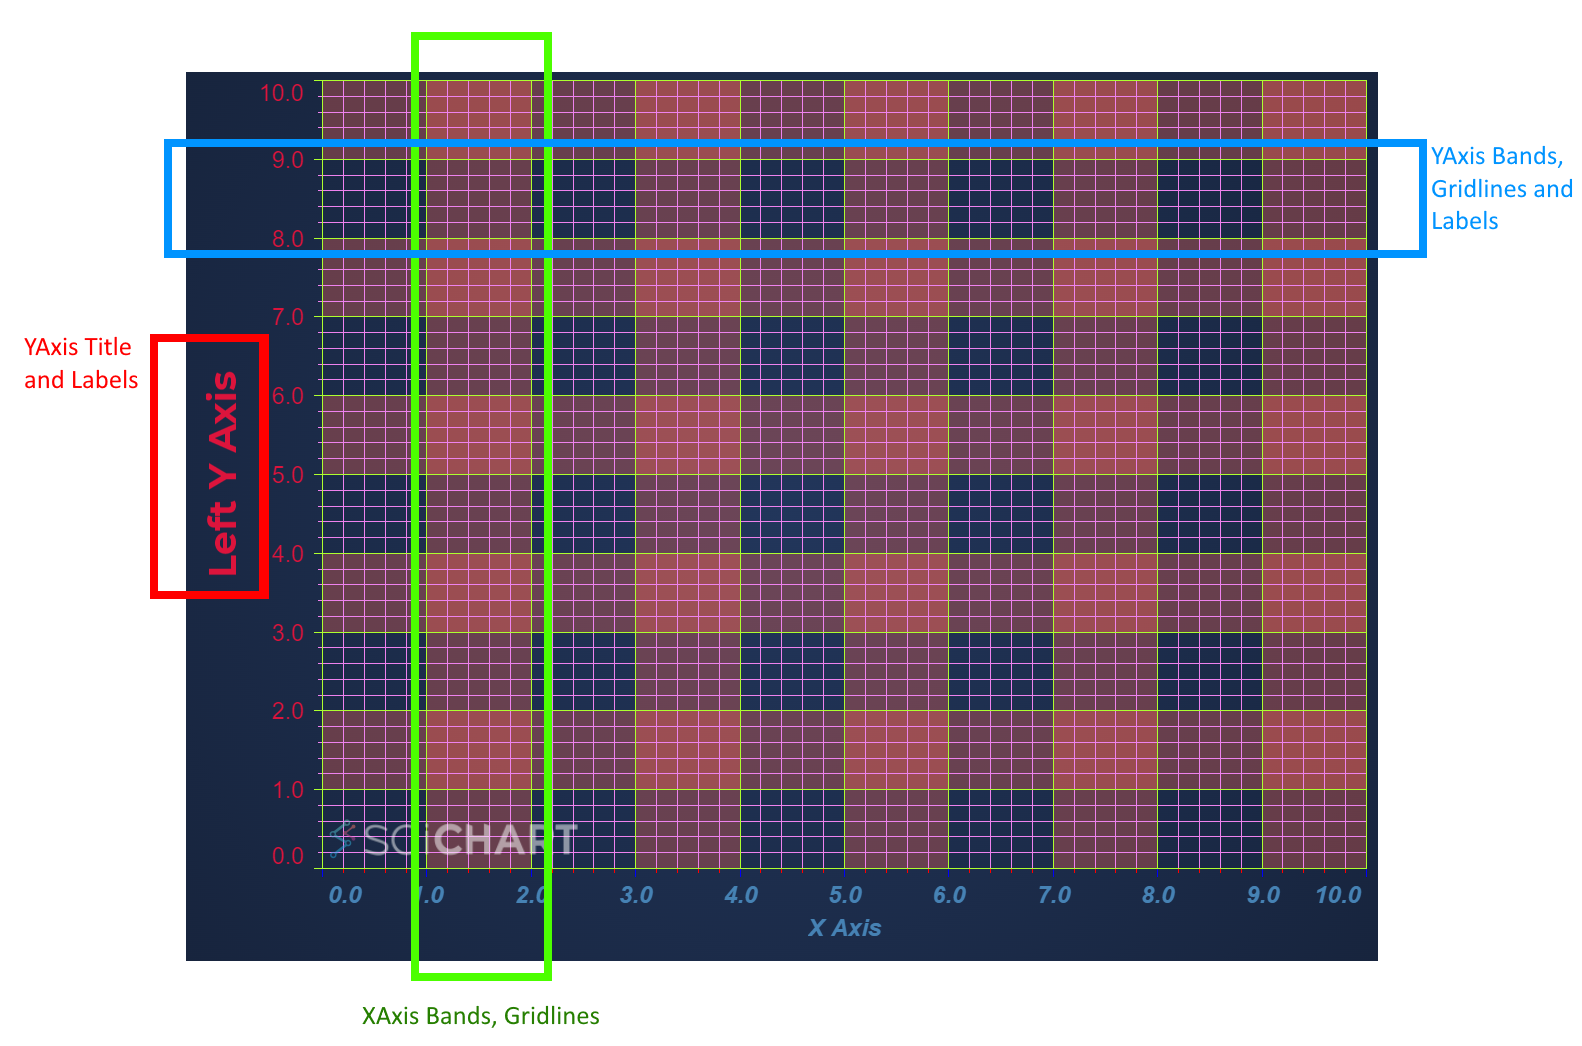
Styling Axis Gridlines, Labels and Titles

To recreate the image above, we can use the following code. We've chosen colours deliberately so you can see what parts are styled by which lines of code!

Note: Gridlines support dashed line via the majorGridLineStyle.strokeDashArray and minorGridLineStyle.strokeDashArray property. For more info about stroke dash to create dotted or dashed line patterns, see Series Styling - Dash Line Patterns
Note: All colors in SciChart.js are strings, which are HTML color codes. Supported values are 6-digit hex codes e.g. "#ADFF2F", 8-digit hex codes in RGBA format where the last two digits are opacity e.g. "#AAFF2F33" and rgba CSS color codes e.g. "rgba(173, 255, 47, 0.3)" as well as "Red", "White" etc...


// Demonstrates how to style numeric axis in SciChart.js
const {
  SciChartSurface,
  NumericAxis,
  SciChartJsNavyTheme,
  EAxisAlignment,
} = SciChart;

// or, for npm, import { SciChartSurface, ... } from "scichart"

const { wasmContext, sciChartSurface } = await SciChartSurface.create(divElementId, {
  theme: new SciChartJsNavyTheme()
});

// Create and style xAxis
sciChartSurface.xAxes.add(
    new NumericAxis(wasmContext, {
      axisTitle: ["X Axis", "bold, italic, with multi-line title"],
      drawMajorBands: true,
      axisBandsFill: "#FF665555",
      axisTitleStyle: {
        fontSize: 16,
        fontFamily: "Arial",
        color: "#4682b4",
        fontWeight: "bold",
        fontStyle: "italic"
      },
      majorGridLineStyle: { strokeThickness: 1, color: "#ADFF2F", strokeDasharray: [10, 5] },
      minorGridLineStyle: { strokeThickness: 1, color: "#EE82EE", strokeDasharray: [2, 2] },
      majorTickLineStyle: { strokeThickness: 1, color: "Blue", tickSize: 8 },
      minorTickLineStyle: { strokeThickness: 1, color: "Red", tickSize: 4 },
      labelStyle: {
        fontSize: 16,
        fontWeight: "bold",
        fontStyle: "Italic",
        color: "#4682b4",
        fontFamily: "Arial"
      }
    })
);

// Create and style left YAxis
sciChartSurface.yAxes.add(
    new NumericAxis(wasmContext, {
      axisAlignment: EAxisAlignment.Left,
      axisBandsFill: "#FF665555",
      axisTitle: "Left Y Axis",
      axisTitleStyle: {
        fontSize: 25,
        fontFamily: "Montserrat",
        fontWeight: "bold",
        color: "#DC143C"
      },
      majorGridLineStyle: { strokeThickness: 1, color: "#ADFF2F", strokeDasharray: [10, 5] },
      minorGridLineStyle: { strokeThickness: 1, color: "#EE82EE", strokeDasharray: [2, 2] },
      majorTickLineStyle: { strokeThickness: 1, color: "#ADFF2F", tickSize: 8 },
      minorTickLineStyle: { strokeThickness: 1, color: "#EE82EE",  tickSize: 4 },
      labelStyle: {
        fontSize: 15,
        color: "#DC143C",
        fontFamily: "Arial"
      }
    })
);

sciChartSurface.yAxes.add(new NumericAxis(wasmContext, {
    axisAlignment: EAxisAlignment.Right,
    axisTitle: ["Right Axis", "Rotation: 0"],
    axisTitleStyle: {
      fontSize: 18,
      rotation: 0
    }
  })
);
// Demonstrates how to style a numeric axis in SciChart.js using the Builder API
const {
  chartBuilder,
  ESeriesType,
  EThemeProviderType,
  EAutoRange,
  EAxisAlignment,
  ENumericFormat,
  EAxisType,
} = SciChart;

// or, for npm, import { chartBuilder, ... } from "scichart"

const { wasmContext, sciChartSurface } = await chartBuilder.build2DChart(divElementId, {
  surface: { theme: { type: EThemeProviderType.Dark } },
  xAxes: {
    type: EAxisType.NumericAxis,
    options: {
      axisTitle: "X Axis",
      drawMajorBands: true,
      axisBandsFill: "#FF665555",
      axisTitleStyle: {
        fontSize: 16,
        fontFamily: "Arial",
        color: "#4682b4",
        fontWeight: "bold",
        fontStyle: "italic"
      },
      majorGridLineStyle: { strokeThickness: 1, color: "#ADFF2F", strokeDasharray: [10, 5] },
      minorGridLineStyle: { strokeThickness: 1, color: "#EE82EE", strokeDasharray: [2, 2] },
      majorTickLineStyle: { strokeThickness: 1, color: "Blue", tickSize: 8 },
      minorTickLineStyle: { strokeThickness: 1, color: "Red", tickSize: 4 },
      labelStyle: {
        fontSize: 16,
        fontWeight: "bold",
        fontStyle: "Italic",
        color: "#4682b4",
        fontFamily: "Arial"
      }
    }
  },
  yAxes: {
    type: EAxisType.NumericAxis,
    options: {
      axisAlignment: EAxisAlignment.Left,
      axisBandsFill: "#FF665555",
      axisTitle: "Left Y Axis",
      axisTitleStyle: {
        fontSize: 25,
        fontFamily: "Montserrat",
        fontWeight: "bold",
        color: "#DC143C"
      },
      majorGridLineStyle: { strokeThickness: 1, color: "#ADFF2F", strokeDasharray: [10, 5] },
      minorGridLineStyle: { strokeThickness: 1, color: "#EE82EE", strokeDasharray: [2, 2] },
      majorTickLineStyle: { strokeThickness: 1, color: "#ADFF2F", tickSize: 8 },
      minorTickLineStyle: { strokeThickness: 1, color: "#EE82EE",  tickSize: 4 },
      labelStyle: {
        fontSize: 15,
        color: "#DC143C",
        fontFamily: "Arial"
      }
    }
  }
});

This results in the following output:

<div id="scichart-root" ></div>
  
body { margin: 0; }
#scichart-root { width: 100%; height: 100vh; }
  
async function axisStyling(divElementId) {
  // #region ExampleA
  // Demonstrates how to style numeric axis in SciChart.js
  const {
    SciChartSurface,
    NumericAxis,
    SciChartJsNavyTheme,
    EAxisAlignment,
  } = SciChart;

  // or, for npm, import { SciChartSurface, ... } from "scichart"

  const { wasmContext, sciChartSurface } = await SciChartSurface.create(divElementId, {
    theme: new SciChartJsNavyTheme()
  });

  // Create and style xAxis
  sciChartSurface.xAxes.add(
      new NumericAxis(wasmContext, {
        axisTitle: ["X Axis", "bold, italic, with multi-line title"],
        drawMajorBands: true,
        axisBandsFill: "#FF665555",
        axisTitleStyle: {
          fontSize: 16,
          fontFamily: "Arial",
          color: "#4682b4",
          fontWeight: "bold",
          fontStyle: "italic"
        },
        majorGridLineStyle: { strokeThickness: 1, color: "#ADFF2F", strokeDasharray: [10, 5] },
        minorGridLineStyle: { strokeThickness: 1, color: "#EE82EE", strokeDasharray: [2, 2] },
        majorTickLineStyle: { strokeThickness: 1, color: "Blue", tickSize: 8 },
        minorTickLineStyle: { strokeThickness: 1, color: "Red", tickSize: 4 },
        labelStyle: {
          fontSize: 16,
          fontWeight: "bold",
          fontStyle: "Italic",
          color: "#4682b4",
          fontFamily: "Arial"
        }
      })
  );

  // Create and style left YAxis
  sciChartSurface.yAxes.add(
      new NumericAxis(wasmContext, {
        axisAlignment: EAxisAlignment.Left,
        axisBandsFill: "#FF665555",
        axisTitle: "Left Y Axis",
        axisTitleStyle: {
          fontSize: 25,
          fontFamily: "Montserrat",
          fontWeight: "bold",
          color: "#DC143C"
        },
        majorGridLineStyle: { strokeThickness: 1, color: "#ADFF2F", strokeDasharray: [10, 5] },
        minorGridLineStyle: { strokeThickness: 1, color: "#EE82EE", strokeDasharray: [2, 2] },
        majorTickLineStyle: { strokeThickness: 1, color: "#ADFF2F", tickSize: 8 },
        minorTickLineStyle: { strokeThickness: 1, color: "#EE82EE",  tickSize: 4 },
        labelStyle: {
          fontSize: 15,
          color: "#DC143C",
          fontFamily: "Arial"
        }
      })
  );

  sciChartSurface.yAxes.add(new NumericAxis(wasmContext, {
      axisAlignment: EAxisAlignment.Right,
      axisTitle: ["Right Axis", "Rotation: 0"],
      axisTitleStyle: {
        fontSize: 18,
        rotation: 0
      }
    })
  );
  // #endregion
};

axisStyling("scichart-root");


async function builderExample(divElementId) {
  // #region ExampleB
  // Demonstrates how to style a numeric axis in SciChart.js using the Builder API
  const {
    chartBuilder,
    ESeriesType,
    EThemeProviderType,
    EAutoRange,
    EAxisAlignment,
    ENumericFormat,
    EAxisType,
  } = SciChart;

  // or, for npm, import { chartBuilder, ... } from "scichart"

  const { wasmContext, sciChartSurface } = await chartBuilder.build2DChart(divElementId, {
    surface: { theme: { type: EThemeProviderType.Dark } },
    xAxes: {
      type: EAxisType.NumericAxis,
      options: {
        axisTitle: "X Axis",
        drawMajorBands: true,
        axisBandsFill: "#FF665555",
        axisTitleStyle: {
          fontSize: 16,
          fontFamily: "Arial",
          color: "#4682b4",
          fontWeight: "bold",
          fontStyle: "italic"
        },
        majorGridLineStyle: { strokeThickness: 1, color: "#ADFF2F", strokeDasharray: [10, 5] },
        minorGridLineStyle: { strokeThickness: 1, color: "#EE82EE", strokeDasharray: [2, 2] },
        majorTickLineStyle: { strokeThickness: 1, color: "Blue", tickSize: 8 },
        minorTickLineStyle: { strokeThickness: 1, color: "Red", tickSize: 4 },
        labelStyle: {
          fontSize: 16,
          fontWeight: "bold",
          fontStyle: "Italic",
          color: "#4682b4",
          fontFamily: "Arial"
        }
      }
    },
    yAxes: {
      type: EAxisType.NumericAxis,
      options: {
        axisAlignment: EAxisAlignment.Left,
        axisBandsFill: "#FF665555",
        axisTitle: "Left Y Axis",
        axisTitleStyle: {
          fontSize: 25,
          fontFamily: "Montserrat",
          fontWeight: "bold",
          color: "#DC143C"
        },
        majorGridLineStyle: { strokeThickness: 1, color: "#ADFF2F", strokeDasharray: [10, 5] },
        minorGridLineStyle: { strokeThickness: 1, color: "#EE82EE", strokeDasharray: [2, 2] },
        majorTickLineStyle: { strokeThickness: 1, color: "#ADFF2F", tickSize: 8 },
        minorTickLineStyle: { strokeThickness: 1, color: "#EE82EE",  tickSize: 4 },
        labelStyle: {
          fontSize: 15,
          color: "#DC143C",
          fontFamily: "Arial"
        }
      }
    }
  });
  // #endregion
};


// Uncomment this to use the builder example
  //builderExample("scichart-root");


Rotation on labels and titles can be achieved by setting the rotation property. For more info read Rotating Axis Labels


Finally, when using Axis NativeText for performance reasons, there are other considerations about fonts. Read the Native Text article for more info.

See Also