import {SciChartSurface} from "scichart/Charting/Visuals/SciChartSurface";
import {NumericAxis} from "scichart/Charting/Visuals/Axis/NumericAxis";
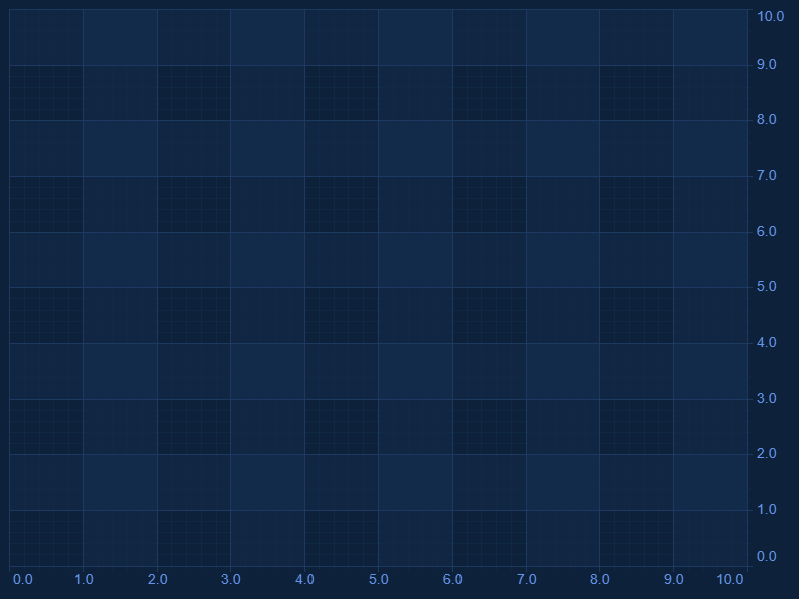
export async function createCustomTheme(divId) {
// Create a custom theme by implementing all the properties from IThemeProvider
const customTheme = {
axisBorder: "Transparent",
axisTitleColor: "#6495ED",
annotationsGripsBackroundBrush: "white",
annotationsGripsBorderBrush: "white",
axis3DBandsFill: "#1F3D6833",
axisBandsFill: "#1F3D6833",
axisPlaneBackgroundFill: "Transparent",
columnFillBrush: "white",
columnLineColor: "white",
cursorLineBrush: "#6495ED99",
defaultColorMapBrush: [
{ offset: 0, color: "DarkBlue" },
{ offset: 0.5, color: "CornflowerBlue" },
{ offset: 1, color: "#FF22AA" }
],
downBandSeriesFillColor: "#52CC5490",
downBandSeriesLineColor: "#E26565FF",
downBodyBrush: "white",
downWickColor: "white",
gridBackgroundBrush: "white",
gridBorderBrush: "white",
labelBackgroundBrush: "#6495EDAA",
labelBorderBrush: "#6495ED",
labelForegroundBrush: "#EEEEEE",
legendBackgroundBrush: "#1D2C35",
lineSeriesColor: "white",
loadingAnimationBackground: "#0D213A",
loadingAnimationForeground: "#6495ED",
majorGridLineBrush: "#1F3D68",
minorGridLineBrush: "#102A47",
mountainAreaBrush: "white",
mountainLineColor: "white",
overviewFillBrush: "white",
planeBorderColor: "white",
rolloverLineBrush: "#FD9F2533",
rubberBandFillBrush: "#99999933",
rubberBandStrokeBrush: "#99999977",
sciChartBackground: "#0D213A",
scrollbarBackgroundBrush: "white",
scrollbarBorderBrush: "white",
scrollbarGripsBackgroundBrush: "white",
scrollbarViewportBackgroundBrush: "white",
scrollbarViewportBorderBrush: "white",
shadowEffectColor: "white",
textAnnotationBackground: "#6495EDAA",
textAnnotationForeground: "#EEEEEE",
tickTextBrush: "#6495ED",
upBandSeriesFillColor: "white",
upBandSeriesLineColor: "white",
upBodyBrush: "#6495EDA0",
upWickColor: "#6495ED"
}
const { sciChartSurface, wasmContext } = await SciChartSurface.create(divId);
sciChartSurface.applyTheme(customTheme);
sciChartSurface.xAxes.add(new NumericAxis(wasmContext));
sciChartSurface.yAxes.add(new NumericAxis(wasmContext));
}
import {SciChartSurface} from "scichart/Charting/Visuals/SciChartSurface";
import {NumericAxis} from "scichart/Charting/Visuals/Axis/NumericAxis";
import {IThemeProvider} from "scichart/Charting/Themes/IThemeProvider";
export async function createCustomThemeTs(divId: string) {
    // Create a custom theme by implementing all the properties from IThemeProvider
    const customTheme: IThemeProvider = {
        axisBorder: "Transparent",
        axisTitleColor: "#6495ED",
        annotationsGripsBackroundBrush: "white",
        annotationsGripsBorderBrush: "white",
        axis3DBandsFill: "#1F3D6833",
        axisBandsFill: "#1F3D6833",
        axisPlaneBackgroundFill: "Transparent",
        columnFillBrush: "white",
        columnLineColor: "white",
        cursorLineBrush: "#6495ED99",
        defaultColorMapBrush: [
            { offset: 0, color: "DarkBlue" },
            { offset: 0.5, color: "CornflowerBlue" },
            { offset: 1, color: "#FF22AA" }
        ],
        downBandSeriesFillColor: "#52CC5490",
        downBandSeriesLineColor: "#E26565FF",
        downBodyBrush: "white",
        downWickColor: "white",
        gridBackgroundBrush: "white",
        gridBorderBrush: "white",
        labelBackgroundBrush: "#6495EDAA",
        labelBorderBrush: "#6495ED",
        labelForegroundBrush: "#EEEEEE",
        legendBackgroundBrush: "#1D2C35",
        lineSeriesColor: "white",
        loadingAnimationBackground: "#0D213A",
        loadingAnimationForeground: "#6495ED",
        majorGridLineBrush: "#1F3D68",
        minorGridLineBrush: "#102A47",
        mountainAreaBrush: "white",
        mountainLineColor: "white",
        overviewFillBrush: "white",
        planeBorderColor: "white",
        rolloverLineBrush: "#FD9F2533",
        rubberBandFillBrush: "#99999933",
        rubberBandStrokeBrush: "#99999977",
        sciChartBackground: "#0D213A",
        scrollbarBackgroundBrush: "white",
        scrollbarBorderBrush: "white",
        scrollbarGripsBackgroundBrush: "white",
        scrollbarViewportBackgroundBrush: "white",
        scrollbarViewportBorderBrush: "white",
        shadowEffectColor: "white",
        textAnnotationBackground: "#6495EDAA",
        textAnnotationForeground: "#EEEEEE",
        tickTextBrush: "#6495ED",
        upBandSeriesFillColor: "white",
        upBandSeriesLineColor: "white",
        upBodyBrush: "#6495EDA0",
        upWickColor: "#6495ED"
    }
    const { sciChartSurface, wasmContext } = await SciChartSurface.create(divId);
    sciChartSurface.applyTheme(customTheme);
    sciChartSurface.xAxes.add(new NumericAxis(wasmContext));
    sciChartSurface.yAxes.add(new NumericAxis(wasmContext));
}