import { SciChartSurface } from 'scichart/Charting/Visuals/SciChartSurface';
import { NumericAxis } from 'scichart/Charting/Visuals/Axis/NumericAxis';
import { NumberRange } from 'scichart/Core/NumberRange';
import { DpiHelper } from 'scichart/Charting/Visuals/TextureManager/DpiHelper';
import { CustomAnnotation } from 'scichart/Charting/Visuals/Annotations/CustomAnnotation';
import { EHorizontalAnchorPoint, EVerticalAnchorPoint } from 'scichart/types/AnchorPoint';
import { XyDataSeries } from 'scichart/Charting/Model/XyDataSeries';
import { FastColumnRenderableSeries } from 'scichart/Charting/Visuals/RenderableSeries/FastColumnRenderableSeries';
export async function hitTestColumnTs(divId) {
const { sciChartSurface, wasmContext } = await SciChartSurface.create(divId);
sciChartSurface.xAxes.add(new NumericAxis(wasmContext, { growBy: new NumberRange(0.05, 0.05) }));
sciChartSurface.yAxes.add(new NumericAxis(wasmContext, { growBy: new NumberRange(0.05, 0.05) }));
// Column series
const xColumnValues = [0, 1, 2, 3, 4, 5, 6, 7, 8];
const yColumnValues = [0, 0.2, 1, 2.0, 2.5, 1.9, 1.9, 1.5, 1.2];
const columnSeries = new FastColumnRenderableSeries(wasmContext, {
fill: 'rgba(255,255,255,0.9)',
dataPointWidth: 0.5,
dataSeries: new XyDataSeries(wasmContext, {
xValues: xColumnValues,
yValues: yColumnValues
})
});
sciChartSurface.renderableSeries.add(columnSeries);
// Add an SVG annotation to display the mouse click
const svgAnnotation = new CustomAnnotation({
svgString: `<svg width="8" height="8"><circle cx="50%" cy="50%" r="4" fill="#FF0000"/></svg>`,
isHidden: true,
horizontalAnchorPoint: EHorizontalAnchorPoint.Center,
verticalAnchorPoint: EVerticalAnchorPoint.Center
});
sciChartSurface.annotations.add(svgAnnotation);
sciChartSurface.domCanvas2D.addEventListener('mousedown', (mouseEvent) => {
const mouseClickX = mouseEvent.offsetX;
const mouseClickY = mouseEvent.offsetY;
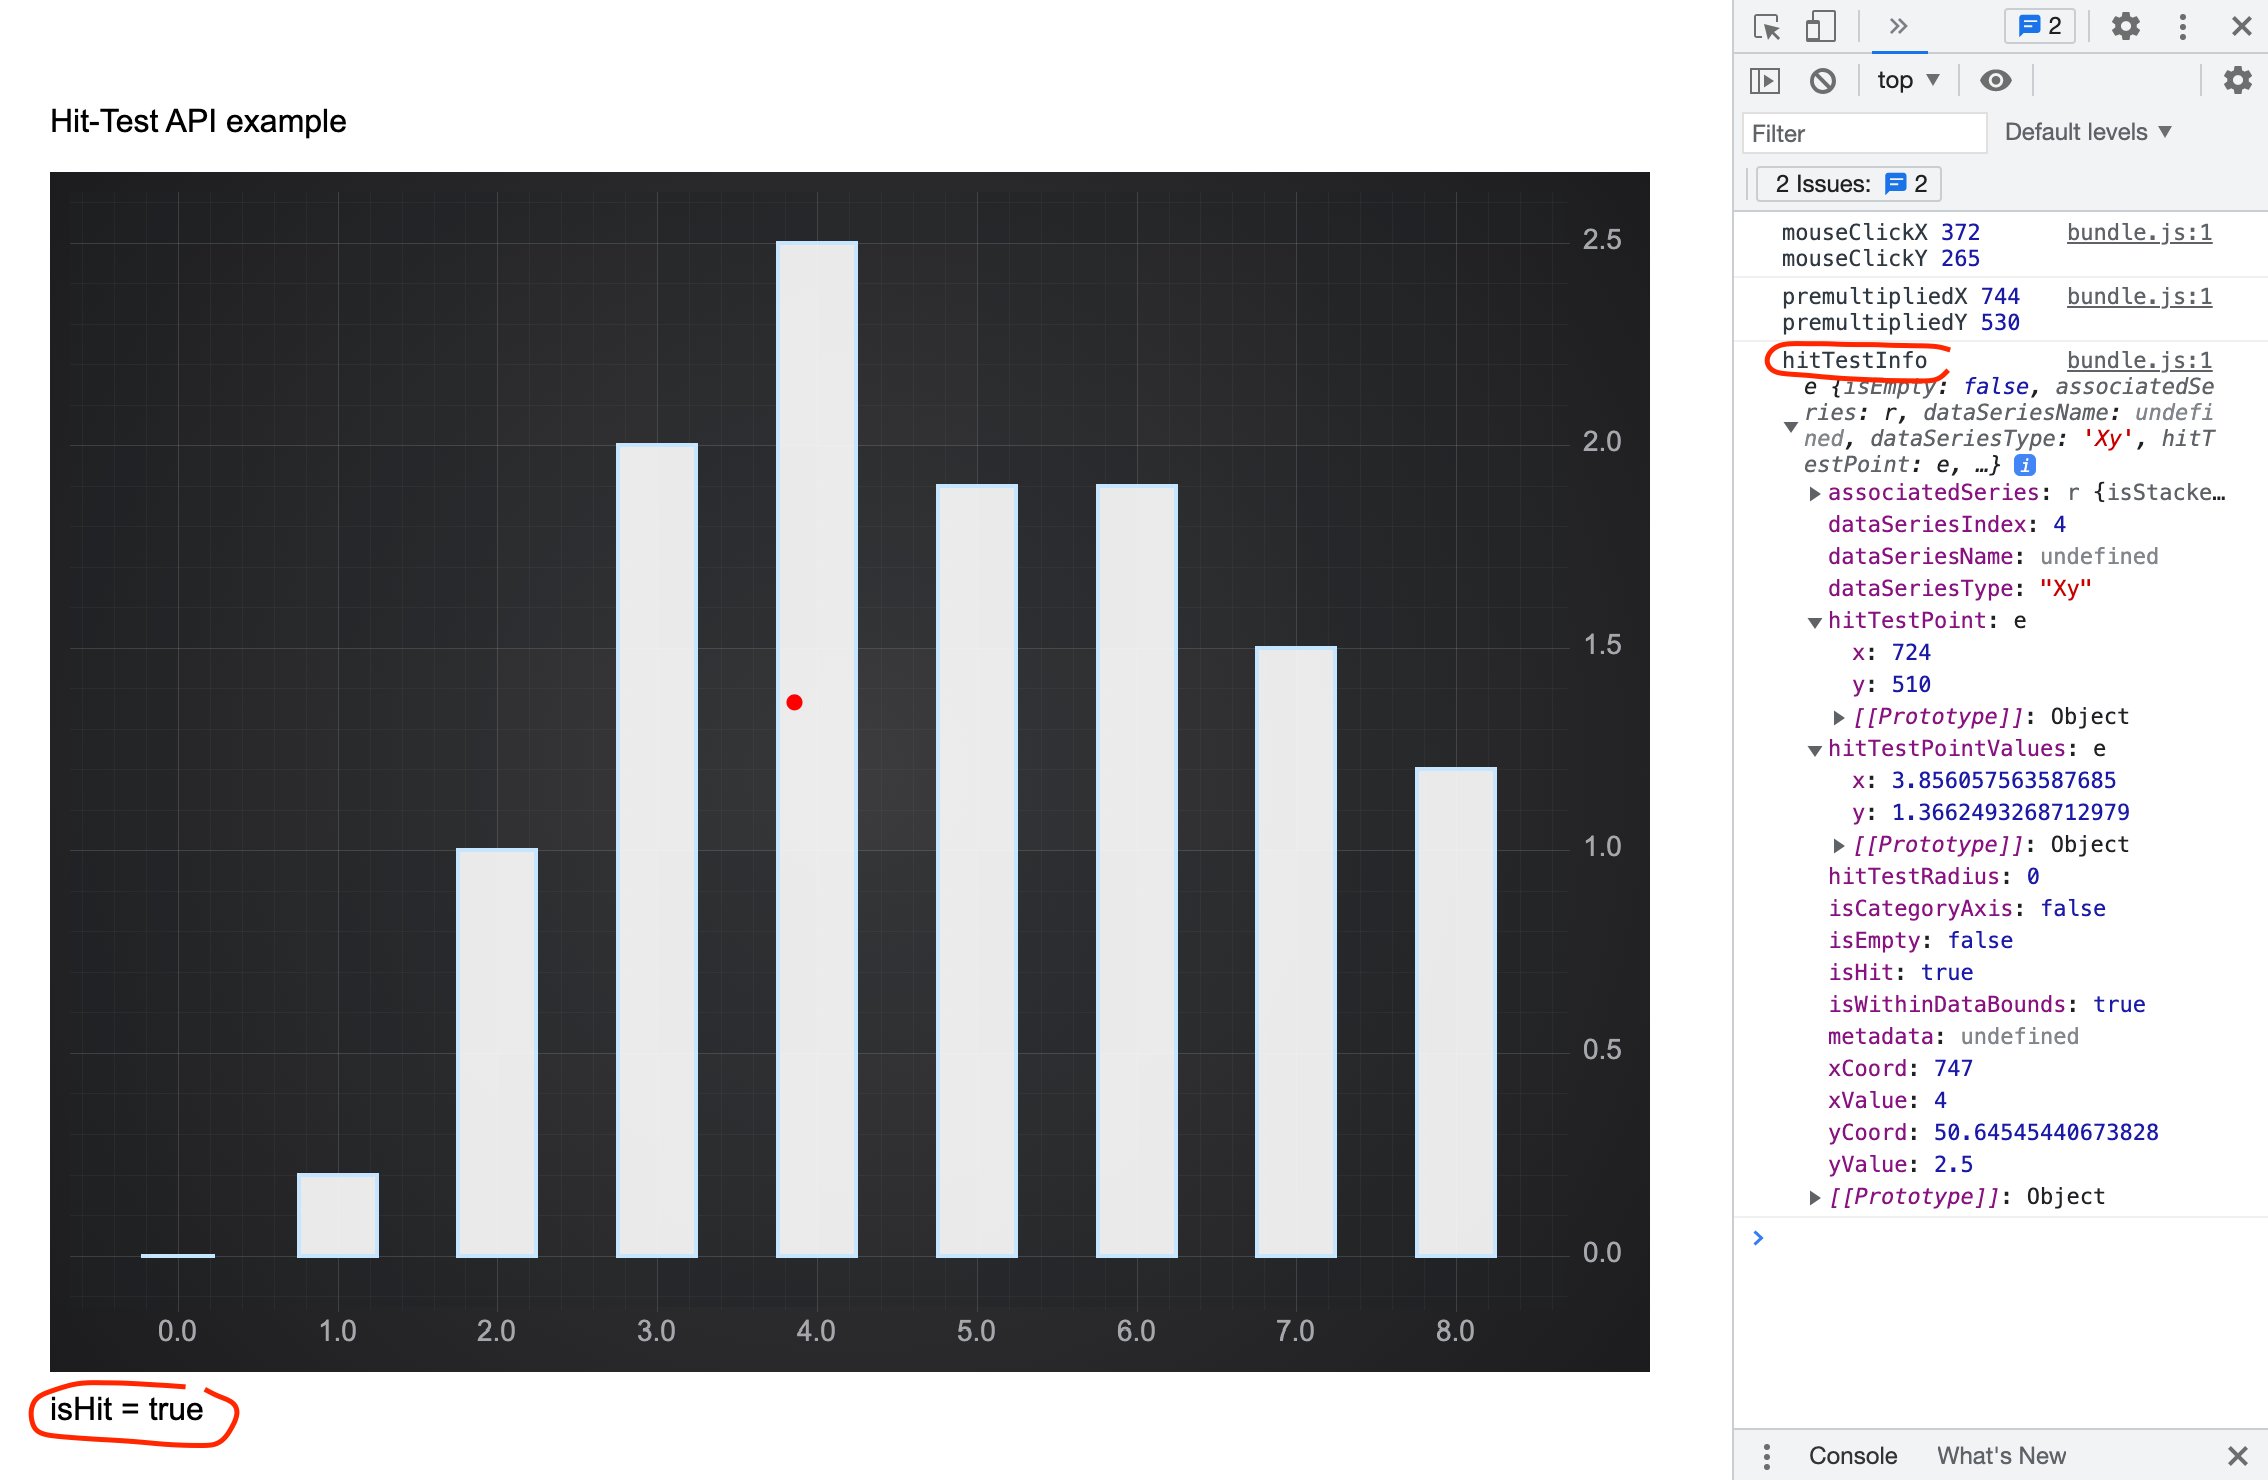
console.log('mouseClickX', mouseClickX, 'mouseClickY', mouseClickY);
const premultipliedX = mouseEvent.offsetX * DpiHelper.PIXEL_RATIO;
const premultipliedY = mouseEvent.offsetY * DpiHelper.PIXEL_RATIO;
console.log('premultipliedX', premultipliedX, 'premultipliedY', premultipliedY);
// IHitTestProvider.hitTest
const hitTestInfo = columnSeries.hitTestProvider.hitTest(premultipliedX, premultipliedY);
svgAnnotation.x1 = hitTestInfo.hitTestPointValues.x;
svgAnnotation.y1 = hitTestInfo.hitTestPointValues.y;
svgAnnotation.isHidden = false;
const resultDiv = document.getElementById('result');
resultDiv.innerText = `isHit = ${hitTestInfo.isHit}`;
console.log('hitTestInfo', hitTestInfo);
});
}
import { SciChartSurface } from 'scichart/Charting/Visuals/SciChartSurface';
import { NumericAxis } from 'scichart/Charting/Visuals/Axis/NumericAxis';
import { NumberRange } from 'scichart/Core/NumberRange';
import { DpiHelper } from 'scichart/Charting/Visuals/TextureManager/DpiHelper';
import { CustomAnnotation } from 'scichart/Charting/Visuals/Annotations/CustomAnnotation';
import { EHorizontalAnchorPoint, EVerticalAnchorPoint } from 'scichart/types/AnchorPoint';
import { XyDataSeries } from 'scichart/Charting/Model/XyDataSeries';
import { FastColumnRenderableSeries } from 'scichart/Charting/Visuals/RenderableSeries/FastColumnRenderableSeries';
export async function hitTestColumnTs(divId: string) {
    const { sciChartSurface, wasmContext } = await SciChartSurface.create(divId);
    sciChartSurface.xAxes.add(new NumericAxis(wasmContext, { growBy: new NumberRange(0.05, 0.05) }));
    sciChartSurface.yAxes.add(new NumericAxis(wasmContext, { growBy: new NumberRange(0.05, 0.05) }));
    // Column series
    const xColumnValues = [0, 1, 2, 3, 4, 5, 6, 7, 8];
    const yColumnValues = [0, 0.2, 1, 2.0, 2.5, 1.9, 1.9, 1.5, 1.2];
    const columnSeries = new FastColumnRenderableSeries(wasmContext, {
        fill: 'rgba(255,255,255,0.9)',
        dataPointWidth: 0.5,
        dataSeries: new XyDataSeries(wasmContext, {
            xValues: xColumnValues,
            yValues: yColumnValues
        })
    });
    sciChartSurface.renderableSeries.add(columnSeries);
    // Add an SVG annotation to display the mouse click
    const svgAnnotation = new CustomAnnotation({
        svgString: `<svg width="8" height="8"><circle cx="50%" cy="50%" r="4" fill="#FF0000"/></svg>`,
        isHidden: true,
        horizontalAnchorPoint: EHorizontalAnchorPoint.Center,
        verticalAnchorPoint: EVerticalAnchorPoint.Center
    });
    sciChartSurface.annotations.add(svgAnnotation);
    sciChartSurface.domCanvas2D.addEventListener('mousedown', (mouseEvent: MouseEvent) => {
        const mouseClickX = mouseEvent.offsetX;
        const mouseClickY = mouseEvent.offsetY;
        console.log('mouseClickX', mouseClickX, 'mouseClickY', mouseClickY);
        const premultipliedX = mouseEvent.offsetX * DpiHelper.PIXEL_RATIO;
        const premultipliedY = mouseEvent.offsetY * DpiHelper.PIXEL_RATIO;
        console.log('premultipliedX', premultipliedX, 'premultipliedY', premultipliedY);
        // IHitTestProvider.hitTest
        const hitTestInfo = columnSeries.hitTestProvider.hitTest(premultipliedX, premultipliedY);
        svgAnnotation.x1 = hitTestInfo.hitTestPointValues.x;
        svgAnnotation.y1 = hitTestInfo.hitTestPointValues.y;
        svgAnnotation.isHidden = false;
        const resultDiv = document.getElementById('result');
        resultDiv.innerText = `isHit = ${hitTestInfo.isHit}`;
        console.log('hitTestInfo', hitTestInfo);
    });
}