import { SciChartSurface } from 'scichart/Charting/Visuals/SciChartSurface';
import { NumericAxis } from 'scichart/Charting/Visuals/Axis/NumericAxis';
import { DpiHelper } from 'scichart/Charting/Visuals/TextureManager/DpiHelper';
import { CustomAnnotation } from 'scichart/Charting/Visuals/Annotations/CustomAnnotation';
import { EHorizontalAnchorPoint, EVerticalAnchorPoint } from 'scichart/types/AnchorPoint';
import { NumberRange } from 'scichart/Core/NumberRange';
import { XyDataSeries } from 'scichart/Charting/Model/XyDataSeries';
import { HitTestInfo } from 'scichart/Charting/Visuals/RenderableSeries/HitTest/HitTestInfo';
import { StackedMountainRenderableSeries } from 'scichart/Charting/Visuals/RenderableSeries/StackedMountainRenderableSeries';
import { StackedMountainCollection } from 'scichart/Charting/Visuals/RenderableSeries/StackedMountainCollection';
export async function hitTestStackedMountainTs(divId) {
const xValues = [1, 2, 3, 4, 5, 6, 7, 8, 9, 10, 11, 12, 13, 14, 15, 16, 17, 18];
const y1Values = [4, 7, 5.2, 9.4, 3.8, 5.1, 7.5, 12.4, 14.6, 8.1, 11.7, 14.4, 16, 3.7, 5.1, 6.4, 3.5, 2.5];
const y2Values = [15, 10.1, 10.2, 10.4, 10.8, 1.1, 11.5, 3.4, 4.6, 0.1, 1.7, 14.4, 6, 13.7, 10.1, 8.4, 8.5, 12.5];
const y3Values = [5, 5, 5, 5, 5, 5, 5, 5, 5, 5, 5, 5, 4, 3, 3, 2, 2, 2];
const { sciChartSurface, wasmContext } = await SciChartSurface.create(divId);
const xAxis = new NumericAxis(wasmContext);
sciChartSurface.xAxes.add(xAxis);
const yAxis = new NumericAxis(wasmContext);
yAxis.growBy = new NumberRange(0, 0.1);
sciChartSurface.yAxes.add(yAxis);
const dataSeries1 = new XyDataSeries(wasmContext, { xValues, yValues: y1Values });
const dataSeries2 = new XyDataSeries(wasmContext, { xValues, yValues: y2Values });
const dataSeries3 = new XyDataSeries(wasmContext, { xValues, yValues: y3Values });
const rendSeries1 = new StackedMountainRenderableSeries(wasmContext);
rendSeries1.dataSeries = dataSeries1;
rendSeries1.fill = '#939899';
rendSeries1.rolloverModifierProps.markerColor = '#7b7e80';
rendSeries1.rolloverModifierProps.tooltipColor = 'rgba(147,152,153,0.7)';
rendSeries1.rolloverModifierProps.tooltipTextColor = '#000';
rendSeries1.isDigitalLine = false;
const rendSeries2 = new StackedMountainRenderableSeries(wasmContext);
rendSeries2.dataSeries = dataSeries2;
rendSeries2.fill = '#66838d';
rendSeries2.rolloverModifierProps.markerColor = '#495d65';
rendSeries2.rolloverModifierProps.tooltipColor = 'rgba(102,131,141,0.7)';
rendSeries2.rolloverModifierProps.tooltipTextColor = '#000';
rendSeries2.isDigitalLine = false;
const rendSeries3 = new StackedMountainRenderableSeries(wasmContext);
rendSeries3.dataSeries = dataSeries3;
rendSeries3.fill = '#368BC1';
rendSeries3.rolloverModifierProps.markerColor = '#2d739e';
rendSeries3.rolloverModifierProps.tooltipColor = 'rgba(54,139,193,0.7)';
rendSeries3.rolloverModifierProps.tooltipTextColor = '#000';
rendSeries3.isDigitalLine = false;
const verticallyStackedMountainCollection = new StackedMountainCollection(wasmContext);
verticallyStackedMountainCollection.add(rendSeries1, rendSeries2, rendSeries3);
sciChartSurface.renderableSeries.add(verticallyStackedMountainCollection);
// Add an SVG annotation to display the mouse click
const svgAnnotation = new CustomAnnotation({
svgString: `<svg width="8" height="8"><circle cx="50%" cy="50%" r="4" fill="#FF0000"/></svg>`,
isHidden: true,
horizontalAnchorPoint: EHorizontalAnchorPoint.Center,
verticalAnchorPoint: EVerticalAnchorPoint.Center
});
sciChartSurface.annotations.add(svgAnnotation);
sciChartSurface.domCanvas2D.addEventListener('mousedown', (mouseEvent) => {
const mouseClickX = mouseEvent.offsetX;
const mouseClickY = mouseEvent.offsetY;
console.log('mouseClickX', mouseClickX, 'mouseClickY', mouseClickY);
const premultipliedX = mouseEvent.offsetX * DpiHelper.PIXEL_RATIO;
const premultipliedY = mouseEvent.offsetY * DpiHelper.PIXEL_RATIO;
console.log('premultipliedX', premultipliedX, 'premultipliedY', premultipliedY);
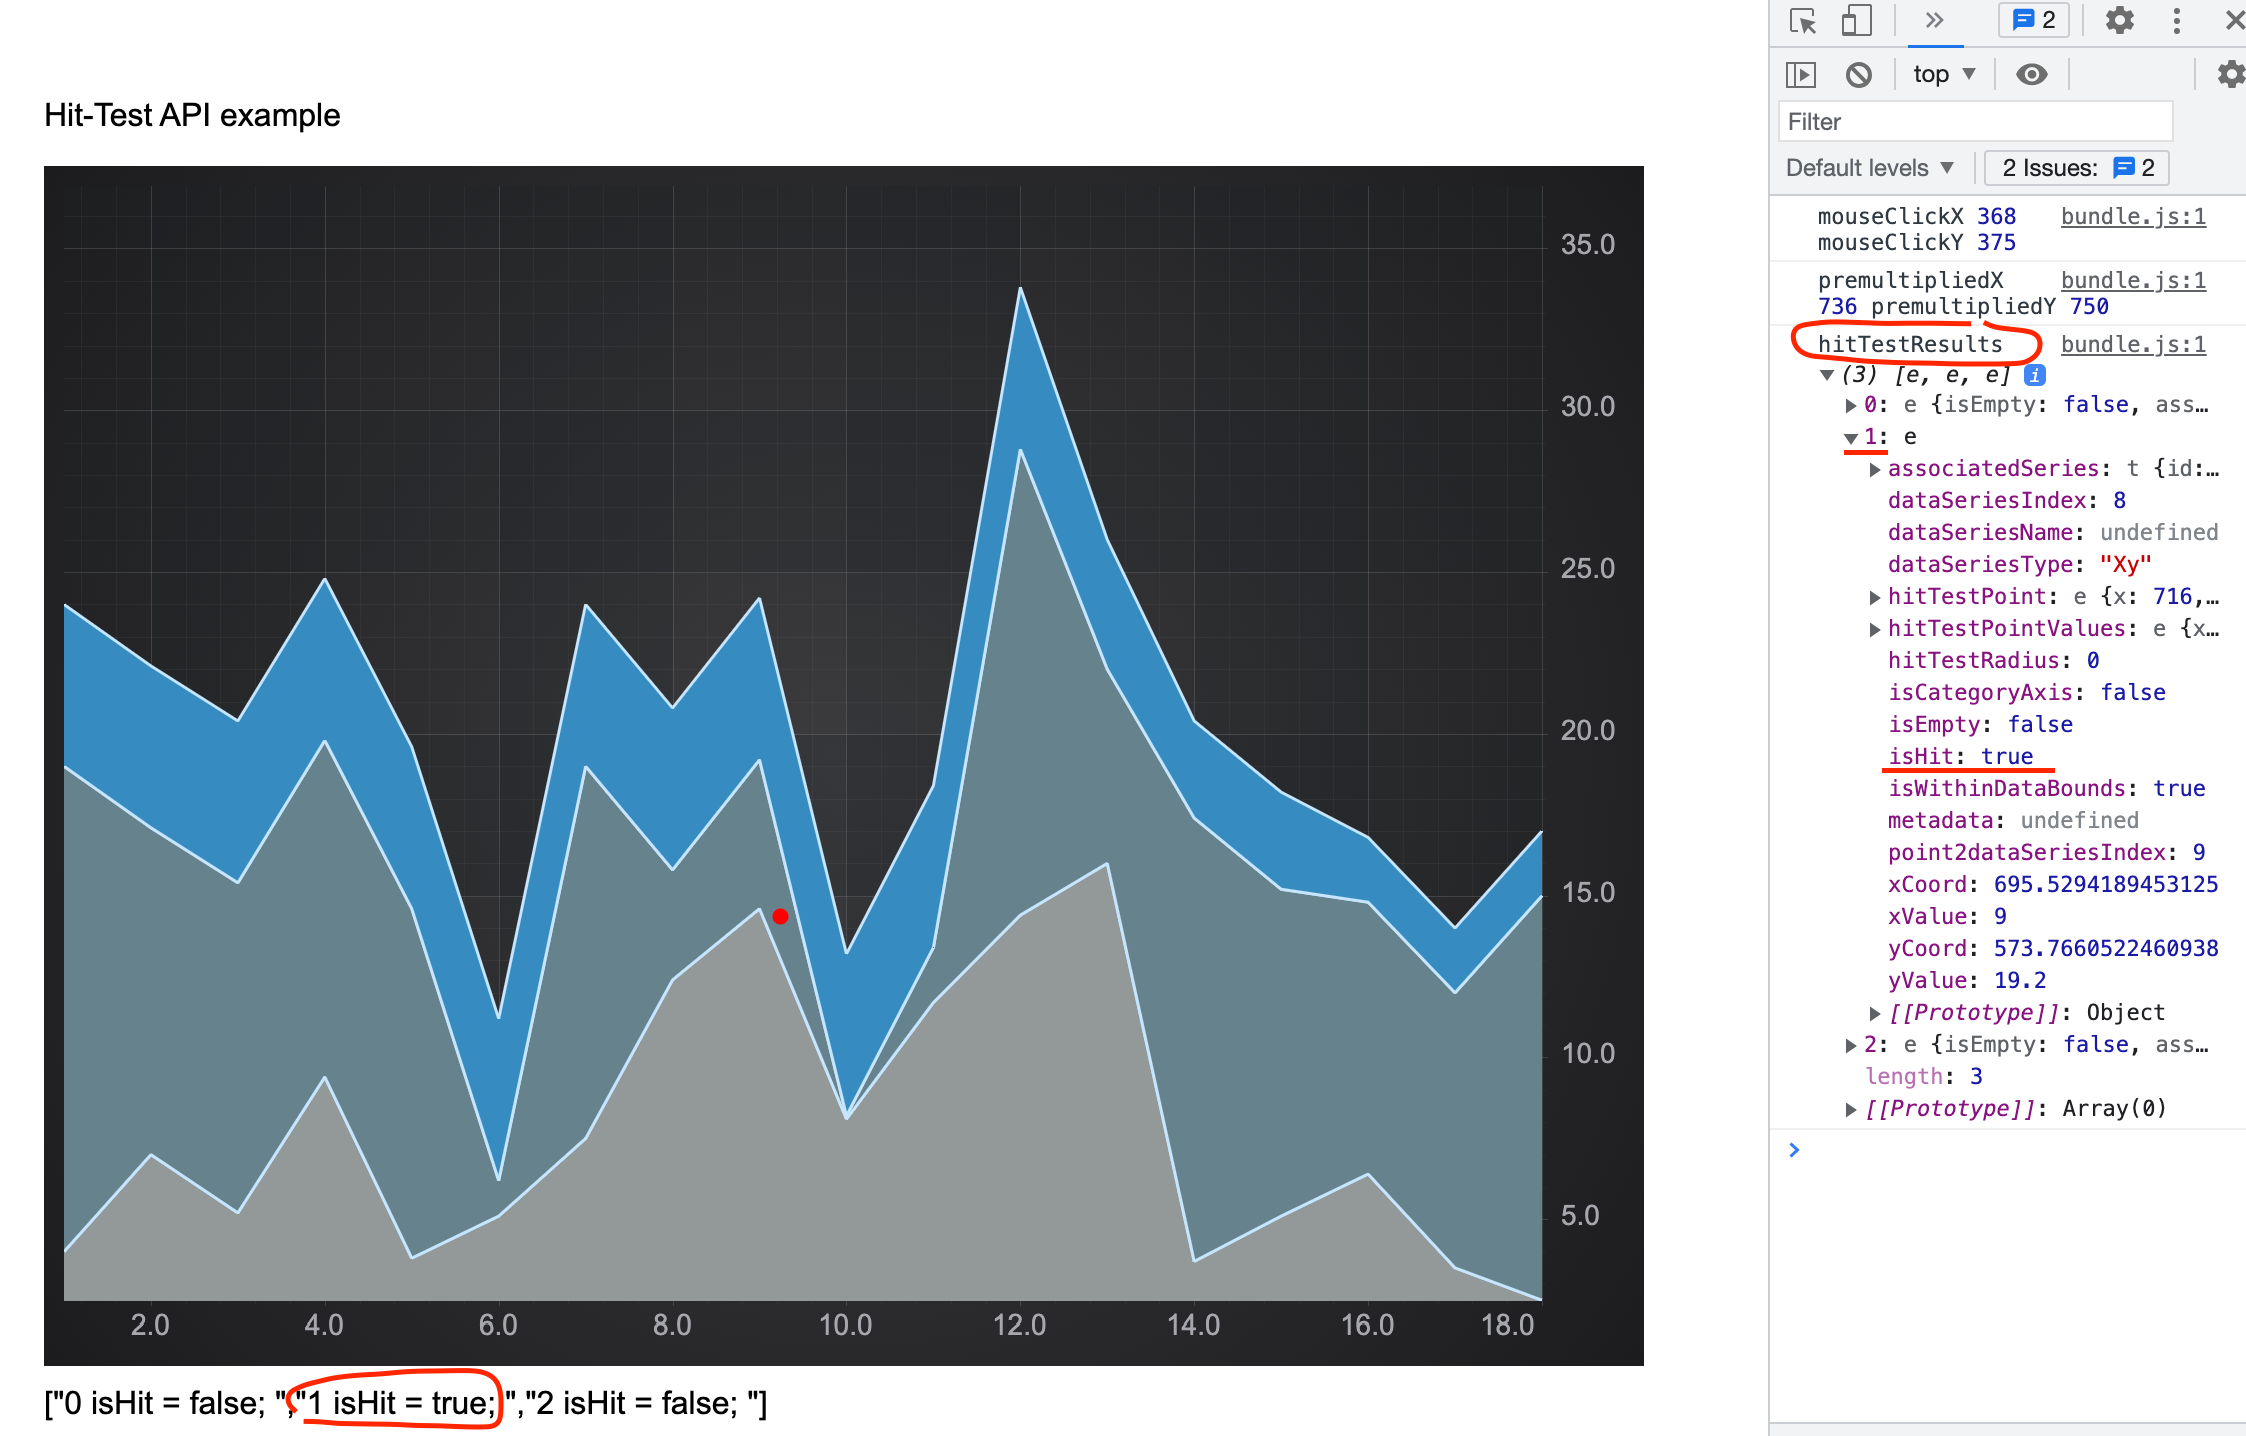
const hitTestResults: HitTestInfo[] = verticallyStackedMountainCollection
.asArray()
.reduce((acc, stackedMountainRS) => {
const hitTestInfo = stackedMountainRS.hitTestProvider.hitTest(premultipliedX, premultipliedY);
acc.push(hitTestInfo);
return acc;
}, []);
svgAnnotation.x1 = hitTestResults[0].hitTestPointValues.x;
svgAnnotation.y1 = hitTestResults[0].hitTestPointValues.y;
svgAnnotation.isHidden = false;
const resultDiv = document.getElementById('result');
resultDiv.innerText = JSON.stringify(
hitTestResults.map((hitTestInfo, index) => `${index} isHit = ${hitTestInfo.isHit}; `)
);
console.log('hitTestResults', hitTestResults);
});
}