In SciChart.js v1.3 and above, we have introduced a property to let you style dashed or dotted lines on certain series.
We have an example in our SciChart.js Examples Suite which shows how to do this - the Dashed Line Chart example.
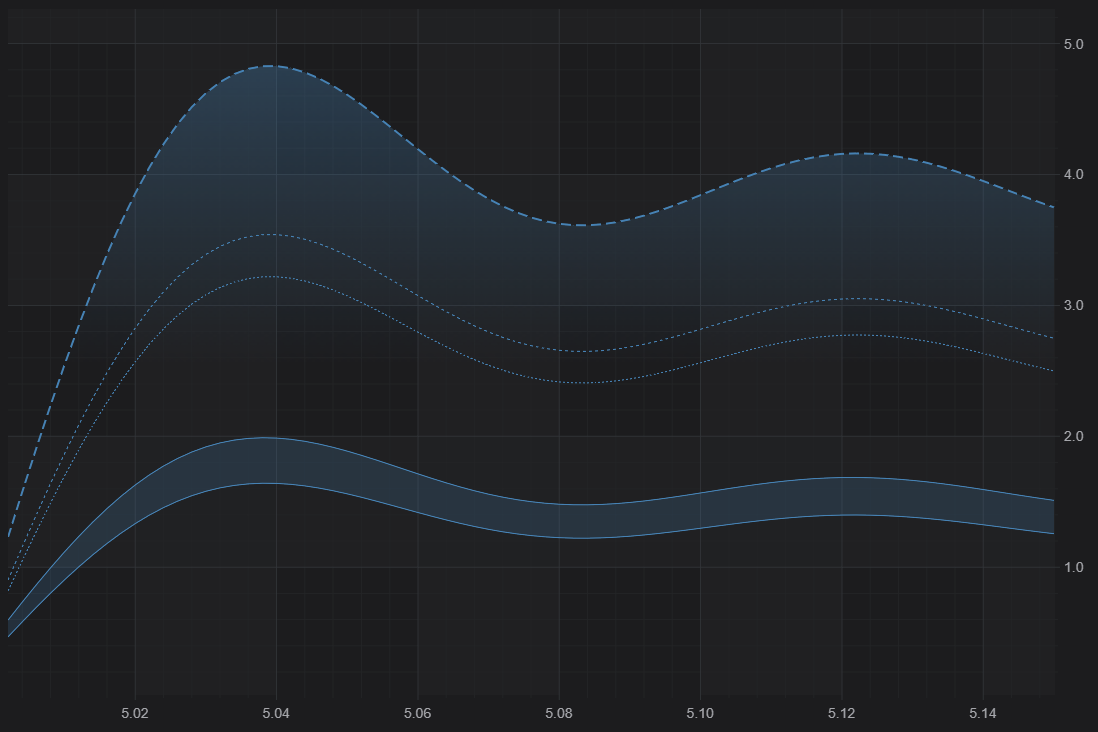
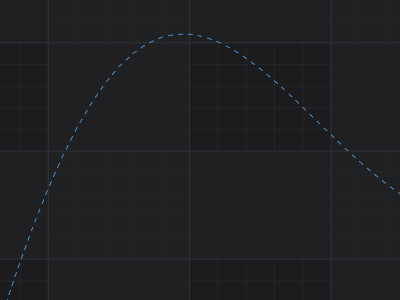
Above: The Dashed Line Styling example in the SciChart.js demo
How to set a Stroke Dash
Certain series have a StrokeDashArray property which allows you to define the line pen as having a dotted or dashed pattern. A variety of dash patterns are possible in SciChart.js using this API.
A StrokeDashArray is an array which defines a dot-dash pattern. For example creating a series with a strokeDashArray as follows:
Results in the following output:
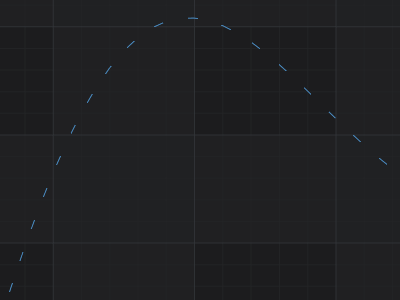
The dash pattern can be configured to provide dots, dashes and more. For example:
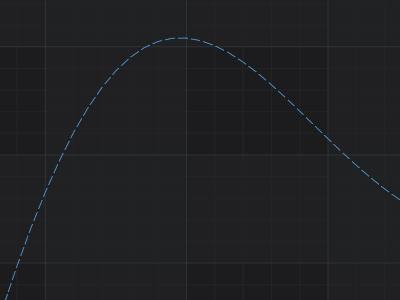
strokeDashArray: [2,2]
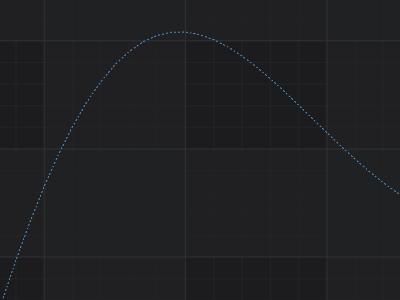
strokeDashArray: [5,5]
strokeDashArray: [10,25]
Which Series support StrokeDashArray?
All the line-based series in SciChart.js support StrokeDashArray for dashed or dotted lines. These are:
- FastLineRenderableSeries.strokeDashArray
- FastMountainRenderableSeries.strokeDashArray
- FastBandRenderableSeries.strokeDashArray
- SplineLineRenderableSeries
- SplineMountainRenderableSeries
- SplineBandRenderableSeries
Chart Parts which support StrokeDashArray
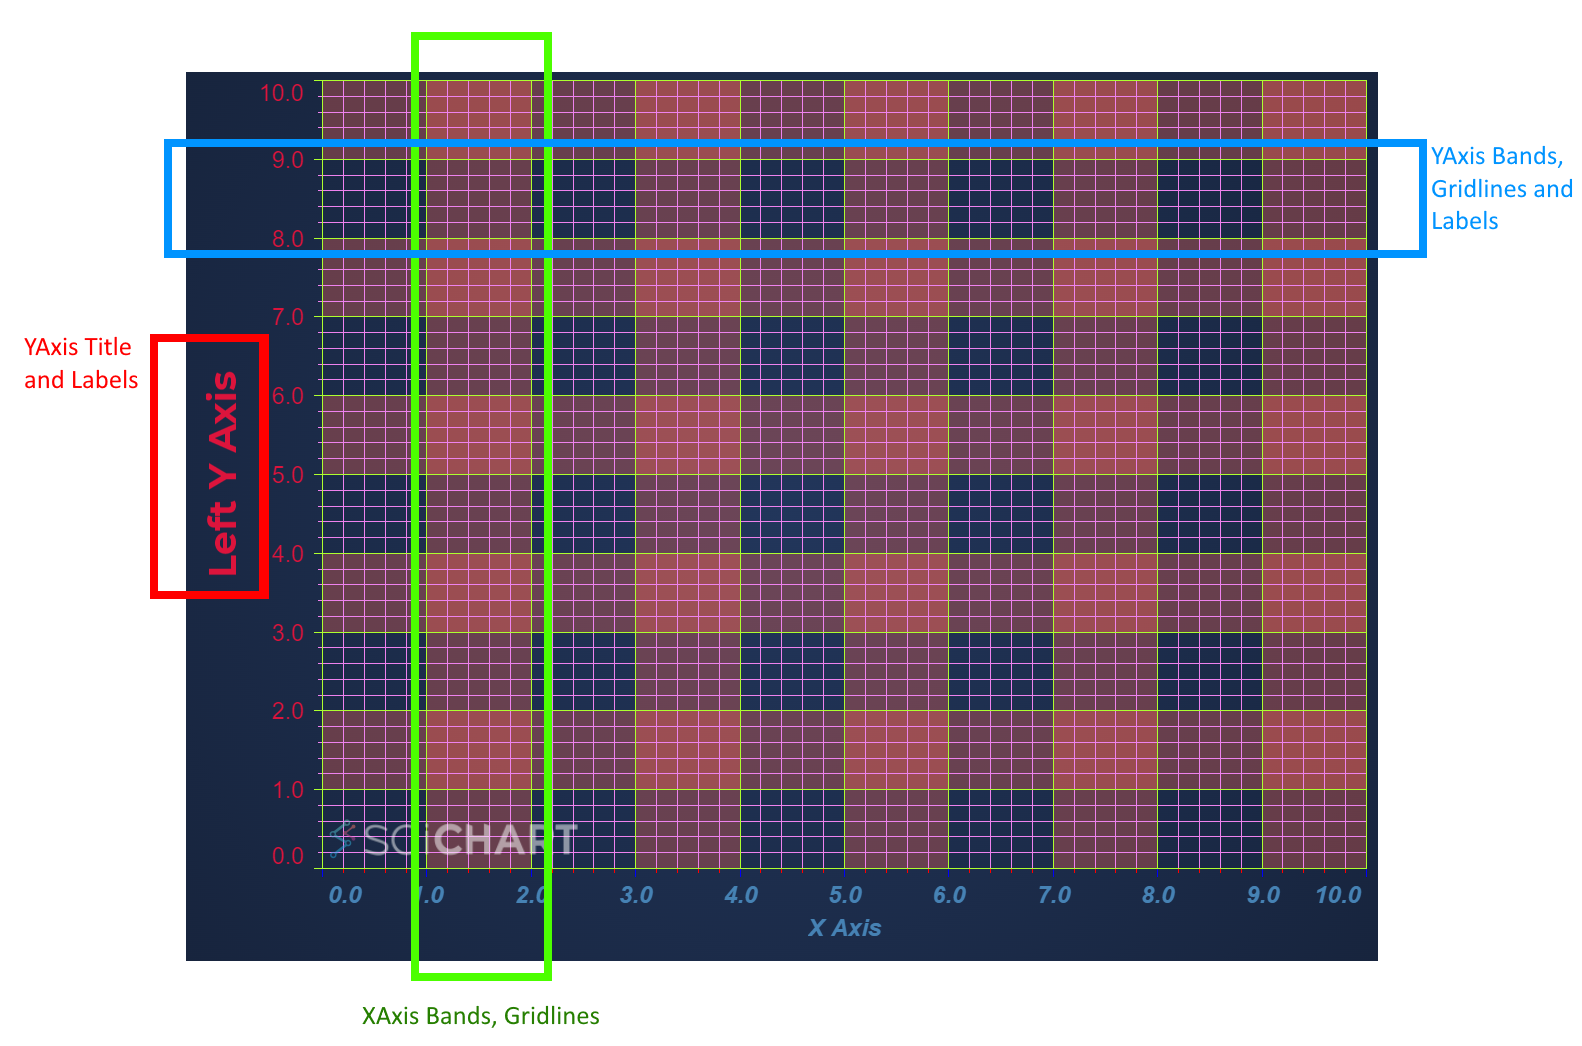
The strokeDashArray property also exists on AxisBase2D.majorGridLineStyle, AxisBase2D.minorGridLineStyle, allowing you to apply stroke dash / dot styling to axis gridlines.
For more information, see the related article Axis Styling - Title, Labels, Gridlines and Axis Bands.