
The Annotations API allows to customize the interaction adorners style of an editable annotation. This includes:
- specifying the grip points that could be used for interaction with the annotation
- specifying the radius of the grip points
- setting a custom svg template for the grips
There is a number of common properties which could be used to customize the look and behavior of interactive annotations. They could be passed as constructor options, which are described by the IAnnotationBaseOptions. And the relevant properties are defined as follows:
| Discrete dragging |
Copy Code
|
|---|---|
/** The direction in which the annotation is allowed to be resized or dragged */ resizeDirections?: EXyDirection; /** if true, the annotation is editable (can be dragged and manipulated by the user) */ isEditable?: boolean; /** The stroke color for the adorner drag handle */ annotationsGripsStroke?: string; /** The fill color for the adorner drag handle */ annotationsGripsFill?: string; /** The radius of the adorner drag handle */ annotationsGripsRadius?: number; /** The stroke color for the adorner selection box */ selectionBoxStroke?: string; /** How much bigger the selection box is than the bounding box of the annotation, in pixels */ selectionBoxDelta?: number; /** The thickness of the selection box line */ selectionBoxThickness?: number; /** The dragPoints that should be enabled for this annotation */ dragPoints?: readonly EDraggingGripPoint[]; |
|
Also, the same properties could be modified using the properties on an annotation instance:
- AnnotationBase.resizeDirections
- AnnotationBase.annotationsGripsStroke
- AnnotationBase.annotationsGripsFill
- AnnotationBase.annotationsGripsRadius
- AnnotationBase.selectionBoxStroke
- AnnotationBase.selectionBoxDelta
- AnnotationBase.selectionBoxThickness
- AnnotationBase.dragPoints
Default Adorners Style
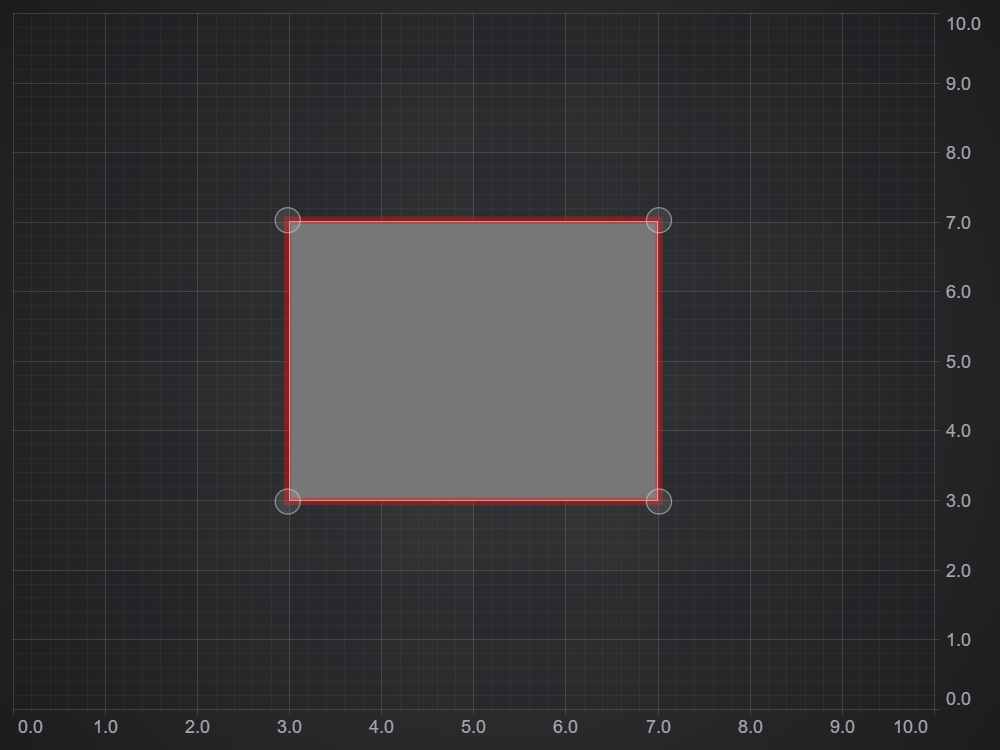
We will start by creating a BoxAnnotation on a surface and will use it as a boilerplate for further examples (other types of annotations could be modified similarly). In order to make the annotation interactable, we will set IAnnotationBaseOptions.isEditable flag. Also we will set IAnnotationBaseOptions.isSelected to display adorners of the annotation.
As you can see the adorners consist of the outlining selection box used for highlighting a selected annotation, and dragging grip points - used to resize or move an annotation when dragged by a cursor.
Custom Adorners Style
Here we will demonstrate how to apply custom styles for the adorners. So in this example we changed the colors and sizes of the selection box and grip points.
Modify the code as follow:
This results in the following output:
<div id="scichart-root"></div>
body {
margin: 0;
}
#scichart-root {
width: 100%;
height: 100vh;
}
const {
BoxAnnotation,
CustomAnnotation,
LineAnnotation,
TextAnnotation,
NumericAxis,
SciChartSurface,
NumberRange,
EHorizontalAnchorPoint,
EVerticalAnchorPoint,
ECoordinateMode,
SciChartJsNavyTheme,
} = SciChart;
// or for npm import { SciChartSurface, ... } from "scichart"
async function addAnnotationToChart(divElementId) {
const { wasmContext, sciChartSurface } = await SciChartSurface.create(
divElementId,
{
theme: new SciChartJsNavyTheme(),
}
);
sciChartSurface.xAxes.add(
new NumericAxis(wasmContext, { visibleRange: new NumberRange(2, 8) })
);
sciChartSurface.yAxes.add(
new NumericAxis(wasmContext, { visibleRange: new NumberRange(2, 8) })
);
// #region ExampleA
// Add a box annotation to the chart and make it editable and selected
// Style the adorners (selectiong grips) using properties
const boxAnnotation = new BoxAnnotation({
  x1: 3,
  x2: 7,
  y1: 3,
  y2: 7,
  isEditable: true,
  isSelected: true,
  // add custom styling
  annotationsGripsStroke: "Blue",
  annotationsGripsFill: "Black",
  selectionBoxStroke: "Green",
  annotationsGripsRadius: 10,
  selectionBoxDelta: 30,
  selectionBoxThickness: 9,
});
sciChartSurface.annotations.add(boxAnnotation);
// #endregion
}
addAnnotationToChart("scichart-root");
async function builderExample(divElementId) {
// #region ExampleB
const { chartBuilder, EAnnotationType } = SciChart;

// or for npm import { SciChartSurface, ... } from "scichart"

// #region ExampleB
// Add a box annotation to the chart using the builder API and make it editable and selected
// Style the adorners (selectiong grips) using properties
const { wasmContext, sciChartSurface } = await chartBuilder.build2DChart(
  divElementId,
  {
    annotations: [
      {
        type: EAnnotationType.RenderContextBoxAnnotation,
        options: {
          x1: 3,
          x2: 7,
          y1: 3,
          y2: 7,
          isEditable: true,
          isSelected: true,
          // add custom styling
          annotationsGripsStroke: "Blue",
          annotationsGripsFill: "Black",
          selectionBoxStroke: "Green",
          annotationsGripsRadius: 10,
          selectionBoxDelta: 30,
          selectionBoxThickness: 9,
        },
      },
    ],
  }
);
// #endregion
}
// Uncomment this to use the builder example //builderExample("scichart-root");
Modifying Dragging Grip Points
By default, an annotation uses all of the predefined grip points for interactions (corners and body), but this can be changed to allow dragging and resizing only using specific ones. For this we will use the IAnnotationBaseOptions.dragPoints (or AnnotationBase.dragPoints) property.
This modifies the output as follows:
<div id="scichart-root"></div>
body {
  margin: 0;
}
#scichart-root {
  width: 100%;
  height: 100vh;
}
const {
BoxAnnotation,
CustomAnnotation,
LineAnnotation,
TextAnnotation,
NumericAxis,
SciChartSurface,
NumberRange,
EHorizontalAnchorPoint,
EVerticalAnchorPoint,
ECoordinateMode,
SciChartJsNavyTheme,
EDraggingGripPoint,
} = SciChart;
// or for npm import { SciChartSurface, ... } from "scichart"
async function addAnnotationToChart(divElementId) {
const { wasmContext, sciChartSurface } = await SciChartSurface.create(
divElementId,
{
theme: new SciChartJsNavyTheme(),
}
);
sciChartSurface.xAxes.add(
new NumericAxis(wasmContext, { visibleRange: new NumberRange(2, 8) })
);
sciChartSurface.yAxes.add(
new NumericAxis(wasmContext, { visibleRange: new NumberRange(2, 8) })
);
// #region ExampleA
// Add a box annotation to the chart and make it editable and selected
// Style the adorners (selectiong grips) using properties
const boxAnnotation = new BoxAnnotation({
  x1: 3,
  x2: 7,
  y1: 3,
  y2: 7,
  isEditable: true,
  isSelected: true,
  // add custom styling
  annotationsGripsStroke: "Blue",
  annotationsGripsFill: "Black",
  selectionBoxStroke: "Green",
  annotationsGripsRadius: 10,
  selectionBoxDelta: 30,
  selectionBoxThickness: 9,
  // Modify the number of grip points
  dragPoints: [EDraggingGripPoint.Body, EDraggingGripPoint.x2y1],
});
sciChartSurface.annotations.add(boxAnnotation);
// #endregion
}
addAnnotationToChart("scichart-root");
async function builderExample(divElementId) {
// #region ExampleB
const { chartBuilder, EAnnotationType } = SciChart;

// or for npm import { SciChartSurface, ... } from "scichart"

// #region ExampleB
// Add a box annotation to the chart using the builder API and make it editable and selected
// Style the adorners (selectiong grips) using properties
const { wasmContext, sciChartSurface } = await chartBuilder.build2DChart(
  divElementId,
  {
    annotations: [
      {
        type: EAnnotationType.RenderContextBoxAnnotation,
        options: {
          x1: 3,
          x2: 7,
          y1: 3,
          y2: 7,
          isEditable: true,
          isSelected: true,
          // add custom styling
          annotationsGripsStroke: "Blue",
          annotationsGripsFill: "Black",
          selectionBoxStroke: "Green",
          annotationsGripsRadius: 10,
          selectionBoxDelta: 30,
          selectionBoxThickness: 9,
          // Modify the number of grip points
          dragPoints: [EDraggingGripPoint.Body, EDraggingGripPoint.x2y1],
        },
      },
    ],
  }
);
// #endregion
}
// Uncomment this to use the builder example //builderExample("scichart-root");
Custom Adorners SVG
More advanced option to customize the adorners is to override the SVG template for the selection box and grips. To do this we can create a derived annotation class, which in this case extends BoxAnnotation. In the class we are overriding the AnnotationBase.getAnnotationGripSvg and AnnotationBase.svgStringAdornerTemplate methods, which are used to create the adorners.
Then simply create and use an instance of the customized annotation:
| Custom Adorners SVG |
Copy Code
|
|---|---|
// use extended class for creating the annotation const boxAnnotation = new CustomBoxAnnotation({ x1: 3, x2: 7, y1: 3, y2: 7, isEditable: true, isSelected: true, }); sciChartSurface.annotations.add(boxAnnotation); |
|
This results in the following output:
<div id="scichart-root"></div>
body {
  margin: 0;
}
#scichart-root {
  width: 100%;
  height: 100vh;
}
const {
BoxAnnotation,
CustomAnnotation,
LineAnnotation,
TextAnnotation,
NumericAxis,
SciChartSurface,
NumberRange,
EHorizontalAnchorPoint,
EVerticalAnchorPoint,
ECoordinateMode,
SciChartJsNavyTheme,
EDraggingGripPoint,
} = SciChart;
// #region ExampleA
class CustomBoxAnnotation extends BoxAnnotation {
  getAnnotationGripSvg(x, y) {
    const size = this.annotationsGripsRadius;
    return `<rect x="${x - size / 2}" y="${
      y - size / 2
    }" width="${size}" height="${size}" fill="${
      this.annotationsGripsFill
    }" stroke="${this.annotationsGripsStroke}"/>`;
  }

  svgStringAdornerTemplate(x1, y1, x2, y2) {
    const width = x2 - x1;
    const height = y2 - y1;
    let svg = `<svg xmlns="http://www.w3.org/2000/svg">
                        <style type="text/css">
                            line { stroke: #474747;  }
                        </style>
                        <defs>
                            <pattern id="grid1" patternUnits="userSpaceOnUse" width="10" height="10">
                                <line x1="0" y1="0" x2="10" y2="10" />
                            </pattern>
                        </defs>
                        <rect x="${x1}" y="${y1}" width="${width}" height="${height}" fill="url(#grid1)"/>
                        `;

    const grips = this.getAdornerAnnotationBorders(false, true);
    if (this.canDragPoint(EDraggingGripPoint.x1y1)) {
      svg += this.getAnnotationGripSvg(grips.x1, grips.y1);
    }
    if (this.canDragPoint(EDraggingGripPoint.x2y2)) {
      svg += this.getAnnotationGripSvg(grips.x2, grips.y2);
    }
    if (this.canDragPoint(EDraggingGripPoint.x2y1)) {
      svg += this.getAnnotationGripSvg(grips.x2, grips.y1);
    }
    if (this.canDragPoint(EDraggingGripPoint.x1y2)) {
      svg += this.getAnnotationGripSvg(grips.x1, grips.y2);
    }
    svg += "</svg>";
    return svg;
  }
}
// #endregion
// or for npm import { SciChartSurface, ... } from "scichart"
async function addAnnotationToChart(divElementId) {
const { wasmContext, sciChartSurface } = await SciChartSurface.create(
divElementId,
{
theme: new SciChartJsNavyTheme(),
}
);
sciChartSurface.xAxes.add(
new NumericAxis(wasmContext, { visibleRange: new NumberRange(2, 8) })
);
sciChartSurface.yAxes.add(
new NumericAxis(wasmContext, { visibleRange: new NumberRange(2, 8) })
);
// Add the custom box annotation to the chart
const boxAnnotation = new CustomBoxAnnotation({
x1: 3,
x2: 7,
y1: 3,
y2: 7,
isEditable: true,
isSelected: true,
});
sciChartSurface.annotations.add(boxAnnotation);
}
addAnnotationToChart("scichart-root");