
The property SciChart3DSurface.Camera defines an ICameraController instance. By default this interface is implemented in CameraController class.
By default, the SciChart3DSurface.Camera is set to a new CameraController instance which defines the position, target (in world coordinates) of the camera, and whether the camera is in Perspective or Orthogonal projection modes.
Camera Position, Target and other Properties
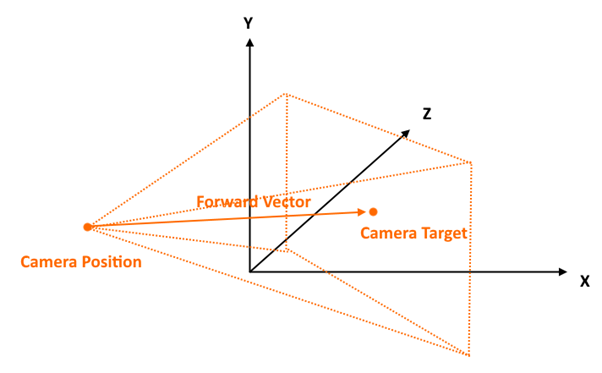
The camera is defined by a position, target which are XYZ vectors in World Coordinates. These can be set in the create() function of SciChart3DSurface or after creation of the chart.
Other properties which define the viewport as seen by the camera include:
| Property | Description | Default |
| position | The position of the camera as a 3-component vector in World coordinates | - |
| target | The target (look-at) of the camera as a 3-component vector in World coordinates | - |
| orbitalPitch | The pitch (vertical rotation angle) above or below the target in degrees. | - |
| orbitalYaw | The yaw (horizontal rotation angle) around the target in degrees | - |
| projectionMode | Defines if the camera is perspectie or orthogonal | Perspective |
| fieldOfView | When projectionMode=Perspective, defines the field of view in degrees | 60 |
| radius | When projectionMode=Perspective get or set the distance of the camera position to target in World units. | - |
| orthoWidth | defines the width of the projected viewport when in projectionMode Orthogonal | 600 |
| orthoHeight | defines the height of the projected viewport when in projectionMode Perspective | 400 |
| nearClip | objects closer than nearClip will be hidden | 1 |
| farClip | objects further than farClip will be hidden | 4000 |
Debugging Camera Properties
You can be notified if any property on the camera is updated by subscribing to camera.propertyChanged. Note that this event will fire for properties set in code, or user input such as rotating, zooming or panning the chart.
It's also possible to debug the camera position & properties by calling camera.debugOutput(). This logs properties to the console window. The same function also returns an array of strings, which you can use to update the UI.
Putting these together you can create the following example:
<div class="wrapper">
<div id="scichart-root" ></div>
<div class="titleWrapper">
<p class="title">SciChart.js 3D Chart Example</p>
<p class="subTitle">Drag the mouse to view camera properties change</p>
</div>
<div id="debug-camera">
<!-- Debug output from camera will be put here -->
</div>
</div>
body { margin: 0; font-family: Arial; }
.wrapper { width: 100%; height: 100vh; position: relative; }
#scichart-root { width: 100%; height: 100%; position: relative; }
.titleWrapper { position: absolute; width: 100%; top: 35%; text-align: center; pointer-events: none; color: #ffffff77 }
.title { font-size: 20px; }
.subTitle { font-size: 16px; }
#debug-camera { pointer-events: none; position: absolute; left: 10px; top: 10px; color: #FFFFFF; background: #00000077; padding: 10px; font-size: 13px }
async function cameraProperties(divElementId) {
const {
SciChart3DSurface,
NumericAxis3D,
Vector3,
SciChartJsNavyTheme,
CameraController,
MouseWheelZoomModifier3D,
OrbitModifier3D,
ResetCamera3DModifier,
} = SciChart;
// or, for npm, import { SciChart3DSurface, ... } from "scichart"
// #region ExampleA
const { wasmContext, sciChart3DSurface } = await SciChart3DSurface.create(divElementId, {
  theme: new SciChartJsNavyTheme(),
  // Optional camera options passed into create Method
  cameraOptions: {
    position: new Vector3(300, 300, 300),
    target: new Vector3(0, 50, 0),
  }
});

// A camera may be attached to a chart after creation
sciChart3DSurface.camera = new CameraController(wasmContext, {
  id: "Primary Camera",
  position: new Vector3(300, 300, 300),
  target: new Vector3(0, 50, 0),
});
// #endregion
// #region ExampleB
const camera = sciChart3DSurface.camera;
// propertyChanged is raised each time any property changes on the camera
camera.propertyChanged.subscribe((args) => {
// Log current properties to console. debugOutput returns array of strings
const cameraDebug = camera.debugOutput();
// Output the same information to a div on the page
document.getElementById("debug-camera").innerHTML = cameraDebug.map(line => `<p>${line}</p>`).join("");
});
// #endregion
// trigger a property change for the example
camera.target = new Vector3(0, 60, 0);
// SciChart.js 3D supports only a single x,y,z axis. Declare your axis like this
sciChart3DSurface.xAxis = new NumericAxis3D(wasmContext, { axisTitle: "X Axis" });
sciChart3DSurface.yAxis = new NumericAxis3D(wasmContext, { axisTitle: "Y Axis" })
sciChart3DSurface.zAxis = new NumericAxis3D(wasmContext, { axisTitle: "Z Axis" });
sciChart3DSurface.chartModifiers.add(
new MouseWheelZoomModifier3D(), // provides camera zoom on mouse wheel
new OrbitModifier3D(), // provides 3d rotation on left mouse drag
new ResetCamera3DModifier()); // resets camera position on double-click
};
cameraProperties("scichart-root");
Camera Perspective vs. Orthogonal Mode
SciChart.js 3D also has an orthogonal mode. In this mode, there is no perspective effect of lines converging or diverging and all lines in the same X,Y or Z plane are parallel.
In Perspective Mode
Camera.position and camera.target are obeyed. Camera.radius can be get/set to adjust the distance between position & target. Camera.fieldOfView is obeyed.
In Orthogonal Mode
Apparent distance to target is defined by camera.orthoWidth and orthoHeight property. Camera.radius is ignored.
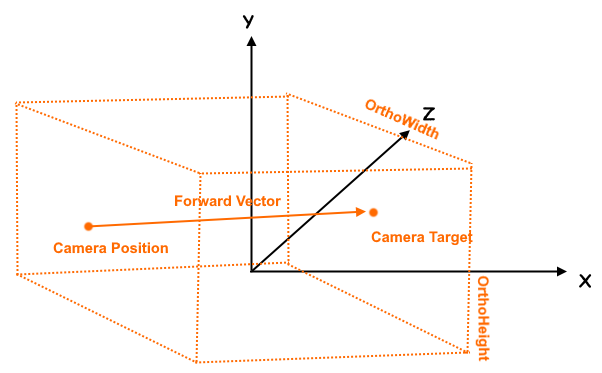
In this mode, radius and fieldOfView are ignored. Update the orthoWidth and orthoHeight property to modify apparent zoom. Camera position, target as well as orbitalPitch, orbitalYaw can be set to define camera orientation.
Find an example demonstrating camera orthogonal projection below.
<div class="wrapper">
    <div id="scichart-root" ></div>
    <div class="titleWrapper">
        <p class="title">SciChart.js 3D Chart Example</p>
        <p class="subTitle">Drag the mouse to view camera properties change</p>
    </div>
    <div id="debug-camera">
        <!-- Debug output from camera will be put here -->
    </div>
</div>
body { margin: 0; font-family: Arial; }
.wrapper { width: 100%; height: 100vh; position: relative; }
#scichart-root { width: 100%; height: 100%; position: relative; }
.titleWrapper { position: absolute; width: 100%; top: 35%; text-align: center; pointer-events: none; color: #ffffff77 }
.title { font-size: 20px; }
.subTitle {  font-size: 16px; }
#debug-camera { pointer-events: none; position: absolute; left: 10px; top: 10px; color: #FFFFFF; background: #00000077; padding: 10px; font-size: 13px }
async function orthogonalProjection(divElementId) {
const {
SciChart3DSurface,
NumericAxis3D,
Vector3,
SciChartJsNavyTheme,
ECameraProjectionMode,
MouseWheelZoomModifier3D,
OrbitModifier3D,
ResetCamera3DModifier,
} = SciChart;
// or, for npm, import { SciChart3DSurface, ... } from "scichart"
// #region ExampleA
const { wasmContext, sciChart3DSurface } = await SciChart3DSurface.create(divElementId, {
  theme: new SciChartJsNavyTheme(),
  cameraOptions: {
    id: "Primary Camera",
    position: new Vector3(400, 400, 400),
    target: new Vector3(0, 100, 0),
  }
});

// Start off with the default camera
const camera = sciChart3DSurface.camera;

// Debug log as before
camera.propertyChanged.subscribe((args) => {
  const cameraDebug = camera.debugOutput();
  document.getElementById("debug-camera").innerHTML = cameraDebug.map(line => `<p>${line}</p>`).join("");
});

// Switch to orthogonal projection
// In orthogonal projection mode, the camera is positioned by position,target
// however the viewing 'cone' no longer obeys perspective but is parallel
//
// orthoWidth/orthoHeight must be set to the desired width/height of the camera's view in world dimensions
// larger numbers means more 'zoomed out'
// aspectRatio is the ratio of orthoWidth/orthoHeight
camera.projectionMode = ECameraProjectionMode.Orthogonal;
camera.orthoWidth = 800;
camera.orthoHeight = 550;

// Also note: SciChart.js has camera.toPersective() and camera.toOrthogonal() methods to quickly switch back/forth
// #endregion
// SciChart.js 3D supports only a single x,y,z axis. Declare your axis like this
sciChart3DSurface.xAxis = new NumericAxis3D(wasmContext, { axisTitle: "X Axis" });
sciChart3DSurface.yAxis = new NumericAxis3D(wasmContext, { axisTitle: "Y Axis" })
sciChart3DSurface.zAxis = new NumericAxis3D(wasmContext, { axisTitle: "Z Axis" });
sciChart3DSurface.chartModifiers.add(
new MouseWheelZoomModifier3D(), // provides camera zoom on mouse wheel
new OrbitModifier3D(), // provides 3d rotation on left mouse drag
new ResetCamera3DModifier()); // resets camera position on double-click
};
orthogonalProjection("scichart-root");