
This set of tutorials will be limited to how to use SciChart.js by including index.min.js in a vanilla JS application (without npm and webpack).
We recommend going through the following tutorials which explain the API first.
... plus several more
How to add SciChart.Browser.js to your project
If you haven't seen our tutorial on how to add SciChart.js to a plain HTML page, then please first read Tutorial 01 - Including SciChart.js in an HTML page.
This shows you how to reference the browser bundle script, initialize webassembly files and create your first basic chart.
Adding Series and Data to a SciChart.js Chart
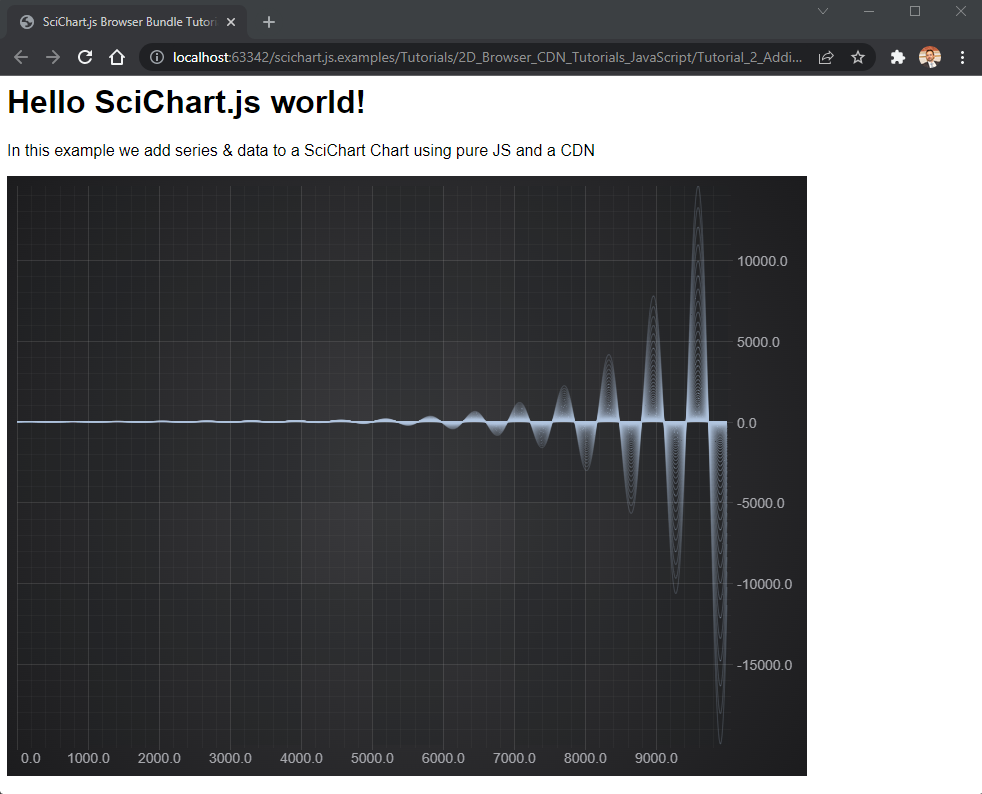
In this tutorial, we are going to add some Line series onto the chart.
First, we will add a FastLineRenderableSeries and add this to the SciChartSurface.renderableSeries collection.
Next, we create an XyDataSeries - which is the type which stores the data, and can accept dynamic updates (real-time updates) and manipulation of data. We will assign the dataseries to the FastLineRenderableSeries.
Try the code below:
| index.html |
Copy Code
|
|---|---|
<html lang="en-us"> <head> <meta charset="utf-8" /> <meta content="text/html; charset=utf-8" http-equiv="Content-Type" /> <title>SciChart.js Browser Bundle Tutorial 2</title> <!-- Note, specific versions can be included by following guidance from https://www.jsdelivr.com/package/npm/scichart --> <script src="https://cdn.jsdelivr.net/npm/scichart/index.min.js" crossorigin="anonymous"></script> <script async type="text/javascript" src="index.js"></script> <style> body { font-family: 'Arial'} </style> </head> <body> <h1>Hello SciChart.js world!</h1> <p>In this example we add series & data to a SciChart Chart using pure JS and a CDN</p> <!-- the Div where the SciChartSurface will reside --> <div id="scichart-root" style="width: 800px; height: 600px;"></div> </body> </html> |
|
| index.js |
Copy Code
|
|---|---|
async function initSciChart() { // LICENSING // // Set your license code here. See https://www.scichart.com/licensing-scichart-js/ // for instructions // Load SciChart.js from CDN. Ensure version numbers match the script in index.html SciChart.SciChartSurface.configure({ dataUrl: `https://cdn.jsdelivr.net/npm/scichart@3.5.782${SciChart.libraryVersion}/_wasm/scichart2d.data`, wasmUrl: `https://cdn.jsdelivr.net/npm/scichart@3.5.782${SciChart.libraryVersion}/_wasm/scichart2d.wasm` }); // Create the SciChartSurface in the div 'scichart-root' // The SciChartSurface, and webassembly context 'wasmContext' are paired. This wasmContext // instance must be passed to other types that exist on the same surface. const {sciChartSurface, wasmContext} = await SciChart.SciChartSurface.create("scichart-root"); // Create an X,Y Axis and add to the chart const xAxis = new SciChart.NumericAxis(wasmContext); const yAxis = new SciChart.NumericAxis(wasmContext); sciChartSurface.xAxes.add(xAxis); sciChartSurface.yAxes.add(yAxis); // Create 100 dataseries, each with 10k points for (let seriesCount = 0; seriesCount < 100; seriesCount++) { const xyDataSeries = new SciChart.XyDataSeries(wasmContext); const opacity = (1 - ((seriesCount / 120))).toFixed(2); // Populate with some data for(let i = 0; i < 10000; i++) { xyDataSeries.append(i, Math.sin(i* 0.01) * Math.exp(i*(0.00001*(seriesCount+1)))); } // Add and create a line series with this data to the chart // Create a line series const lineSeries = new SciChart.FastLineRenderableSeries(wasmContext, { dataSeries: xyDataSeries, stroke: `rgba(176,196,222,${opacity})`, strokeThickness:2 }); sciChartSurface.renderableSeries.add(lineSeries); } } initSciChart(); |
|
This results in the following output:
Breaking the Code Down
- As a first attempt to fix this, ensure that the *.wasm files can be reached at the relative path or URL provided to SciChartSurface.configure().
Look at the Network tab in Google Chrome developer tools to see the network failures for fetching the *.wasm files. Look at the request URL and check that it is correct, and adjust until you no longer get HTTP404

- Next, ensure that the *.wasm files are served with MIME type application/octet-stream.
- Verify the file that was downloaded, that it is actually the correct file & file type.
- Finally, ensure that the version numbers of *.wasm files and index.min.js match. The best way to ensure this is download a specific version again and overwrite files in your source-code repository.
If after that you still are having problems, contact scichart support and we will be glad to help.