
SciChart.js v2.1 is minor update from version 2.0. Our team has worked hard to perform a deep analysis of chart performance, and make several optimisations that have resulted in huge speed improvements to chart rendering.
Major Performance Improvements
For big-data applications or dynamically updating charts, a large bottleneck was simply the time to create and update data.
By looking at memory optimisation and taking advantage of low-level code optimisations in WebAssembly we’ve improved the following DataSeries operations significantly, which results in much faster, more responsive charts. Especially noticeable in dynamic or real-time contexts.
|
DataSeries Operation |
Before |
After |
Improvement |
|
Create a DataSeries with 1Million Datapoints |
35ms |
10ms |
3.5x faster! |
|
Get XRange for DataSeries with unsorted data (required for auto ranging) |
550ms |
3.4ms |
161x faster! |
|
Optimising DataSeries.clear() & append() with 1M datapoints (required for dynamically updating charts) |
386ms |
4.68ms |
82x faster! |
|
Optimising DataSeries.getNativeIndices() with 1M datapoints (required for candlestick charts) |
367ms |
22ms |
16x faster! |
|
DataSeries.insertRange() with 1k datapoints (required for prepending or inserting data) |
>132ms |
0.69ms |
191x faster! |
|
DataSeries.removeRange() with 1k datapoints (required for removing a block of data) |
730ms |
0.33ms |
2,212x faster! |
Datapoint Resampling
New to version 2.1, SciChart.js uses resampling of data to ensure the minimum viable data-set is displayed on the screen. Resampling is intended to be visually lossless, and automatic. It occurs for RenderableSeries before the series is rendered, if required.
Resampling methods make assumptions about the data in order to produce a valid output. SciChart.js provides variety of the resampling modes internally, and auto detects the most suitable one.
Data-point resampling results in large performance improvements to chart types in SciChart.js. See below for a comparison of version 2.0 and version 2.1 chart rendering speed.

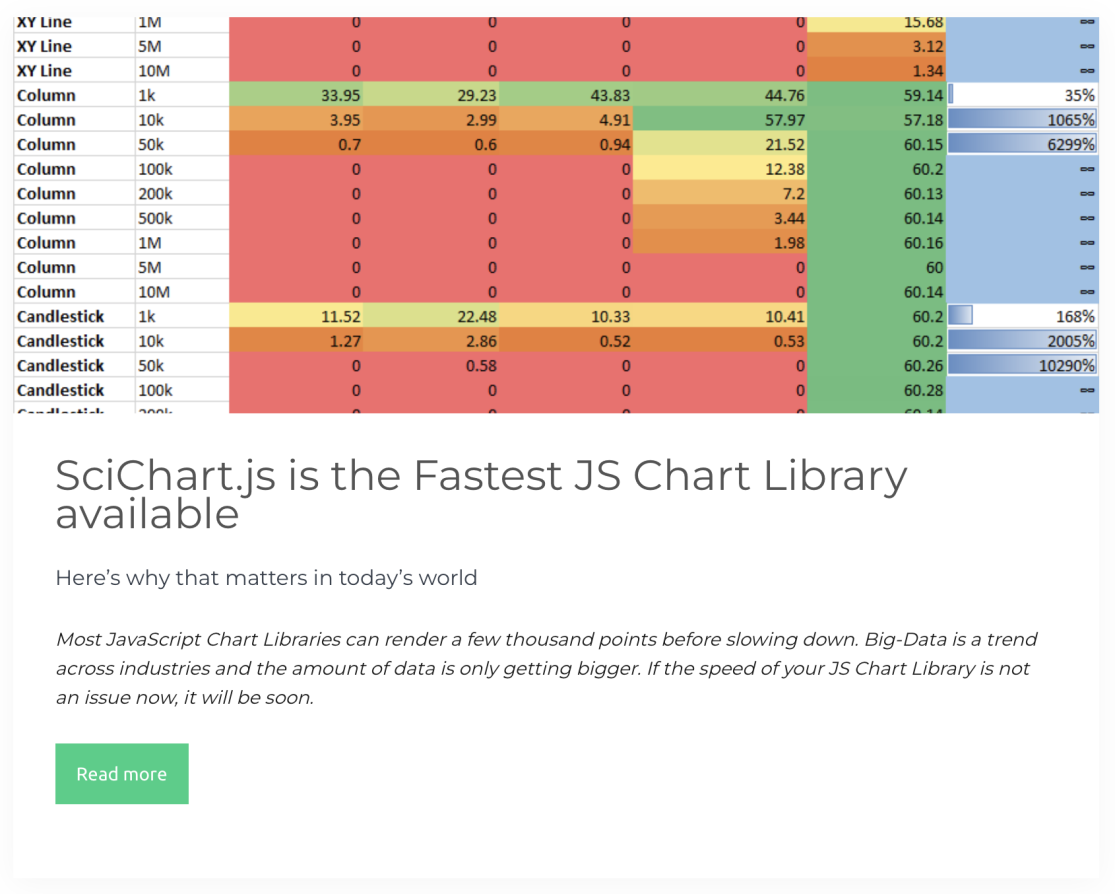
Performance Comparison vs. HighCharts, Chart.js, Plotly.js
As our release focussed on performance improvements, we've also taken the time to build and run a set of demanding test cases vs. popular chart libraries, including HighCharts, Chart.js, Plotly.js.
Read more at the article: SciChart.js - the Fastest JavaScript Chart Library available.
Multiple minor enhancements
In SciChart.js v2.1 we've also added multiple minor enhancements including over 40 bug fixes and minor changes or improvements to the library.
Please see the full release note for more details.