Toolbar Controls
The SDK has ready-made toolbar controls for the interval and the period, so you don't have to build the toolbar yourself. Each only picks a value and calls onChange; you pass it on to the chart with changeInterval or setPeriod.
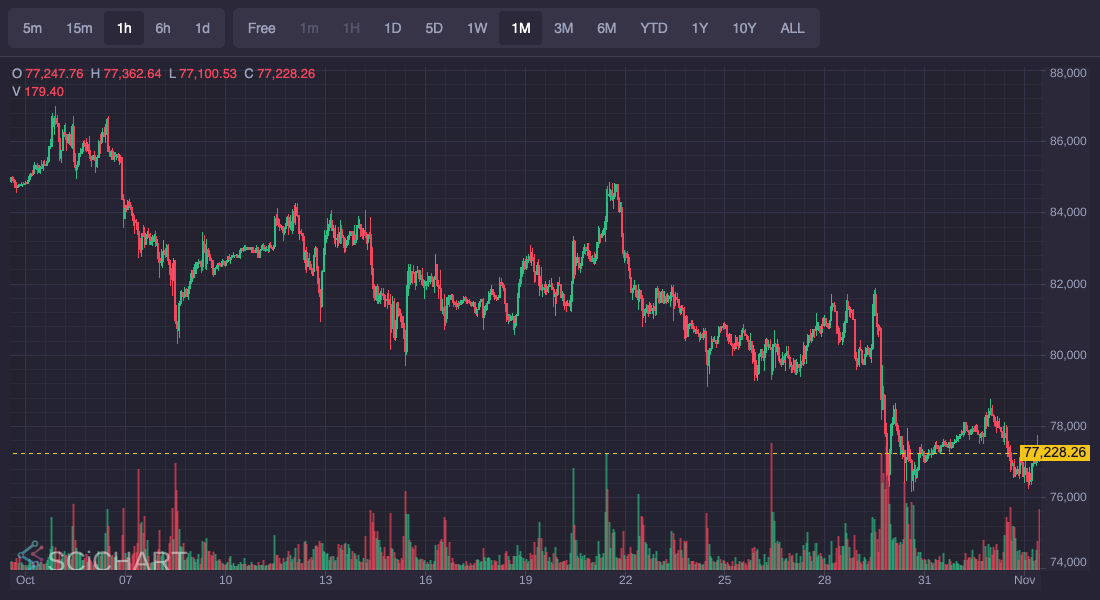
IntervalSelector and PeriodSelector above a SciTrader.js chart
| Control | What it picks | Documented in |
|---|---|---|
Interval | The candle interval: 1m, 1h, 1d, … | Interval and Period Selectors |
Period | The visible period: 1D, 1M, 1Y, …, or "Free" for none | Interval and Period Selectors |
Candle | How prices are drawn: candlesticks, OHLC bars, line, mountain, Heikin-Ashi | Candle Type Selector |
Live | Whether the view follows new candles, or stays where the user left it | Live Tip Toggle |
Each control's page has live TypeScript and React examples with CodePens, its options, and how to style it. They come in plain TypeScript from scichart-scitrader, and in React from scichart-scitrader-react.