The Triangle Series Type
The FastTriangleRenderableSeries is designed to plot data points as triangles, often used for custom scatter plots, mesh visualizations, or highlighting specific data points with a triangle marker. It supports full customization, including stroke, fill, and point marker options.
Triangle Series can be created using the FastTriangleRenderableSeries📘 type.
The FastTriangleRenderableSeries class in SciChart.js is a specialized renderable series used for visualizing data as a series of triangles on a 2D chart. It extends the base BaseRenderableSeries class and provides additional properties and methods tailored for rendering triangle shapes.
Here is a simple Triangle Series example made using XyDataSeries📘:
const sXValues = [200, 200, 300, 320, 420, 420, 220, 400, 310, 220, 400, 310];
const sYValues = [200, 400, 300, 300, 400, 200, 400, 400, 310, 200, 200, 290];

const polygonSeries = new FastTriangleRenderableSeries(wasmContext, {
    dataSeries: new XyDataSeries(wasmContext, {
        xValues: sXValues,
        yValues: sYValues
    }),
    isDigitalLine: false,
    opacity: 0.5,
    drawMode: ETriangleSeriesDrawMode.List, // Polygon / List / Strip
    paletteProvider: new TrianglePaletteProvider()
});
Properties
-
drawMode Determines how the triangles are rendered on the chart. Options that are available are List, Polygon and Strip.
-
ETriangleSeriesDrawMode.List - In this mode, each group of three consecutive points in the list defines an independent triangle. The triangles are not connected, every set of three points forms a separate triangle.
-
ETriangleSeriesDrawMode.Polygon - In this mode, each group of two consecutive points and the first one in the list defines a triangle. The triangles are connected in a way that they share the same point defined by the first point on the list.
-
ETriangleSeriesDrawMode.Strip - In this mode, each group of three consecutive points in the list defines a triangle. The triangles are connected, every point is connected to the last two points.
-
-
fill The fill color of the triangle.
-
dataSeries The data series containing the X, and Y values to plot.
-
isVisible Determines whether the series is visible on the chart.
-
polygonVertices Sets the number of points per polygon. Applies only for drawMode ETriangleSeriesDrawMode.Polygon
Polygon and Strip mode explained by using the same set of data
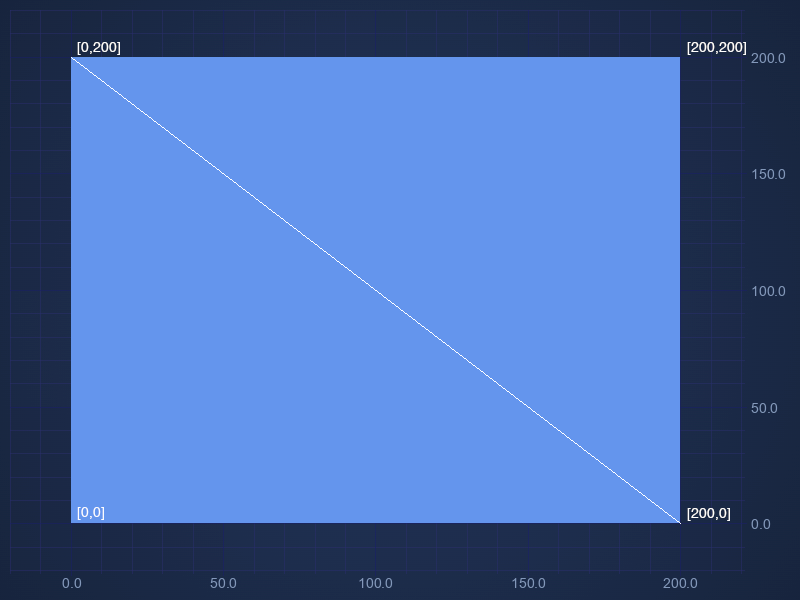
Polygon and Strip modes are explained by using the same set of four coordinates.
const coordinates = [
    [0, 0],
    [0, 200],
    [200, 0],
    [200, 200]
];
Here is the result using Polygon mode. Each group of two consecutive points and the first one in the list defines a triangle. Out of these four points from this data set we have two triangles [[0, 0],[0, 200],[200, 0]] and [[0, 0],[200, 0], [200, 200]]

Here is the result using Strip mode mode. Each group of three consecutive points in the list defines a triangle. Out of these four points from this data set we also have two triangles [[0, 0],[0, 200],[200, 0]] and [[0, 200],[200, 0], [200, 200]]
Examples
Triangle Series List Mode Example
In this mode, each group of three consecutive points in the list defines an independent triangle. The triangles are not connected, every set of three points forms a separate triangle.
const sXValues = [200, 200, 300, 320, 420, 420, 220, 400, 310, 220, 400, 310];
const sYValues = [200, 400, 300, 300, 400, 200, 400, 400, 310, 200, 200, 290];

const polygonSeries = new FastTriangleRenderableSeries(wasmContext, {
    dataSeries: new XyDataSeries(wasmContext, {
        xValues: sXValues,
        yValues: sYValues
    }),
    isDigitalLine: false,
    opacity: 0.5,
    drawMode: ETriangleSeriesDrawMode.List, // Polygon / List / Strip
    paletteProvider: new TrianglePaletteProvider()
});
Triangle Series Polygon Mode Example
In this mode, each group of two consecutive points and the first one in the list defines a triangle. The triangles are connected in a way that they share the same point defined by the first point on the list.
const coordinates = [
    [100, 100],
    [0, 50],
    [50, 0],
    [50, 0],
    [150, 0],
    [200, 50],
    [200, 150],
    [150, 200],
    [50, 200],
    [0, 150],
    [0, 50]
];

const dataSeries = new XyDataSeries(wasmContext, {
    xValues: coordinates.map(p => p[0]),
    yValues: coordinates.map(p => p[1])
});

const triangleSeries = new FastTriangleRenderableSeries(wasmContext, {
    dataSeries,
    drawMode: ETriangleSeriesDrawMode.Polygon, // triangle connects two last points and the first point
    fill: "cornflowerblue",
    opacity: 0.5
});
Triangle Series Strip Mode Example
In this mode, each group of three consecutive points in the list defines a triangle. The triangles are connected, every point is connected to the last two points.
const coordinates = [
    [0, 150],
    [0, 50],
    [50, 0],
    [150, 0],
    [200, 50],
    [200, 150],
    [150, 200],
    [50, 200],
    [0, 150],
    [0, 50]
];
const dataSeries = new XyDataSeries(wasmContext, {
    xValues: coordinates.map(p => p[0]),
    yValues: coordinates.map(p => p[1])
});

const triangleSeries = new FastTriangleRenderableSeries(wasmContext, {
    dataSeries,
    drawMode: ETriangleSeriesDrawMode.Strip, // each group of three consecutive points in the list defines a triangle, every point is connected to the last two points
    fill: "cornflowerblue",
    opacity: 0.5,
    paletteProvider: new TrianglePaletteProvider()
});
Triangle Series Custom Gradient Example
In this example we have used XyxyDataSeries📘 and fillLinearGradient to display custom gradient.
const dataSeries = new XyxyDataSeries(wasmContext);

dataSeries.append(200, 200, 0.5, 0.5);
dataSeries.append(100, 100, 0, 1);
dataSeries.append(100, 300, 0, 0);
dataSeries.append(300, 300, 1, 0);
dataSeries.append(300, 100, 1, 1);
dataSeries.append(100, 100, 0, 1);

dataSeries.append(200, 500, 0, 0);
dataSeries.append(100, 400, 1, 1);
dataSeries.append(100, 600, 1, 1);
dataSeries.append(300, 600, 1, 1);
dataSeries.append(300, 400, 1, 1);
dataSeries.append(100, 400, 1, 1);

dataSeries.append(500, 300, 0, 0.7);
dataSeries.append(600, 500, 0.3, 0.2);
dataSeries.append(700, 550, 0.5, 0);
dataSeries.append(800, 500, 0.7, 0.2);
dataSeries.append(900, 300, 1, 0.7);
dataSeries.append(700, 200, 0.5, 1);

const polygonSeries = new FastTriangleRenderableSeries(wasmContext, {
    dataSeries,
    isDigitalLine: false,
    fill: "cornflowerblue",
    drawMode: ETriangleSeriesDrawMode.Polygon,
    polygonVertices: 6, // Sets the number of vertices per polygon. Applies only for drawMode ETriangleSeriesDrawMode.Polygon
    fillLinearGradient: new GradientParams(new Point(0, 0), new Point(0, 1), [
        { color: "#f39c12", offset: 0 },
        { color: "#8e44ad", offset: 1 }
    ])
});
Triangle Series Texture Example
In Triangle Series Texture example we are using XyxyDataSeries📘, ETriangleSeriesDrawMode.Polygon and customTextureOptions to display rectangles with custom texture that are comprised of four triangles.
const polygonSeries = new FastTriangleRenderableSeries(wasmContext, {
    isDigitalLine: false,
    fill: "cornflowerblue",
    drawMode: ETriangleSeriesDrawMode.Polygon,
    polygonVertices: 6, // Sets the number of vertices per polygon. Applies only for drawMode ETriangleSeriesDrawMode.Polygon
    customTextureOptions: new StickFigureTextureOptions({ stroke: "white" }),
    opacity: 0.5
});

const dataSeries = new XyxyDataSeries(wasmContext);

function generateRectangle(minX, maxX, minY, maxY) {
    const midX = (minX + maxX) / 2;
    const midY = (minY + maxY) / 2;

    [
        [midX, midY, 0.5, 0.5], // Center point
        [minX, minY, 0, 1], // Bottom-left
        [maxX, minY, 1, 1], // Bottom-right
        [maxX, maxY, 1, 0], // Top-right
        [minX, maxY, 0, 0], // Top-left
        [minX, minY, 0, 1] // Bottom-left (duplicate)
    ].forEach(d => {
        dataSeries.append(d[0], d[1], d[2], d[3]);
    });
}

generateRectangle(500, 900, 100, 600);
generateRectangle(350, 450, 100, 600);
generateRectangle(100, 300, 100, 325);
generateRectangle(100, 300, 375, 600);

polygonSeries.dataSeries = dataSeries;
Australia Map Example
In this example we have used Sweep-line algorithm for constrained Delaunay triangulation to convert outline of Australia into series of triangles that can be displayed using ETriangleSeriesDrawMode.List mode.