The Uniform Heatmap Chart Type
Uniform Heatmaps can be created using the UniformHeatmapRenderableSeries📘 type.
The JavaScript Heatmap Chart Example can be found in the SciChart.Js Examples Suite > Heatmap Chart on Github, or our live demo at scichart.com/demo.
Create a Uniform Heatmap
Uniform heatmaps are extremely fast, lightweight series types for rendering two dimensional data as a heatmap or spectrogram. The UniformHeatmapRenderableSeries📘 type should be used in conjunction with a UniformHeatmapDataSeries📘 when you simply want to specify a Step in the X,Y direction (each cell is the same size).
To create a Javascript Heatmap Chart with SciChart.js, use the following code:
Creating the Imports
First, let's setup the imports that we need for the heatmap type.
- TS
// Demonstrates how to create a uniform heatmap chart with SciChart.js
const {
    SciChartSurface,
    NumericAxis,
    HeatmapColorMap,
    UniformHeatmapDataSeries,
    UniformHeatmapRenderableSeries,
    SciChartJsNavyTheme
} = SciChart;
// or, for npm, import { SciChartSurface, ... } from "scichart"
Creating Heatmap ZValues[ ][ ] Array
Next, we want to create a 2-dimensional array of data. Heatmap data is a 2D number array (type number[][] in Typescript) which contains the heat values. These are later mapped to colours in the heatmap.
The dimensions of the zValues 2D array are [height][width]
- TS
// Create some data for the heatmap as a 2d array
// e.g.
// const zValues = [
//   [0, 2, 3.4, 2, 1, 5],
//   [5, 3, 4, 2.2, 7, 4.4],
//   [3, 1.5, 1, 3, 4, 6.4],
//   [2, 1.2, 5.4, 4, 3, 5],
// ];
//
const heatmapWidth = 7;
const heatmapHeight = 4;
const zValues = Array.from(Array(heatmapHeight));
zValues.forEach((row, index, collection) => {
    collection[index] = Array.from(Array(heatmapWidth));
});
for (let x = 0; x < heatmapWidth; x++) {
    for (let y = 0; y < heatmapHeight; y++) {
        zValues[y][x] = 3.5 * ((heatmapHeight - y) * (heatmapWidth - x));
    }
}
Creating the Heatmap Instance
Finally, we create the UniformHeatmapRenderableSeries type, which has both a UniformHeatmapDataSeries for the data and a HeatmapColorMap to map zValues to colors.
Here's a full example below:
- TS
- Builder API (JSON Config)
// Create the uniform heatmap series
const heatmapSeries = new UniformHeatmapRenderableSeries(wasmContext, {
    dataSeries: new UniformHeatmapDataSeries(wasmContext, {
        // 2d zValues array. Dimensions [height][width]
        zValues,
        // xStart, xStep, yStart, yStep defines the x,y position
        xStart: 10,
        xStep: 1,
        yStart: 10,
        yStep: 1
    }),
    // zValues mapped to colours using the colorMap.
    // zValue[y][x] when compared to HeatmapColorMap.maximum corresponds to gradientstop offset=1
    // zValue[y][x] when compared to HeatmapColorMap.minimum corresponds to gradientstop offset=0
    colorMap: new HeatmapColorMap({
        minimum: 0,
        maximum: 100,
        gradientStops: [
            { offset: 1, color: "#EC0F6C" },
            { offset: 0.9, color: "#F48420" },
            { offset: 0.7, color: "#DC7969" },
            { offset: 0.5, color: "#67BDAF" },
            { offset: 0.3, color: "#50C7E0" },
            { offset: 0.2, color: "#264B93" },
            { offset: 0, color: "#14233C" }
        ]
    }),
    // Optional datalabels may be placed in cell
    dataLabels: {
        style: { fontFamily: "Default", fontSize: 16 },
        color: "White"
    }
});

sciChartSurface.renderableSeries.add(heatmapSeries);
// Demonstrates how to create a line chart with SciChart.js using the Builder API
const { chartBuilder, ESeriesType, HeatmapColorMap, EThemeProviderType } = SciChart;
// or, for npm, import { chartBuilder, ... } from "scichart"

const { wasmContext, sciChartSurface } = await chartBuilder.build2DChart(divElementId, {
    surface: { theme: { type: EThemeProviderType.Dark } },
    series: {
        type: ESeriesType.UniformHeatmapSeries,
        options: {
            colorMap: new HeatmapColorMap({
                minimum: 0,
                maximum: 4,
                gradientStops: [
                    { offset: 0, color: "yellow" },
                    { offset: 0.5, color: "blue" },
                    { offset: 1, color: "red" }
                ]
            }),
            dataLabels: {
                style: { fontFamily: "Default", fontSize: 16 },
                color: "White"
            }
        },
        heatmapData: {
            zValues: [
                [0, 2, 3.4],
                [5, 3, 4],
                [3, 1.5, -1]
            ],
            xStart: 10,
            xStep: 1,
            yStart: 10,
            yStep: 1
        }
    }
});
This results in the following output:
Click 'Edit on CodePen' in the example above to see the full example in your browser!
Adding Data Labels (Text Labels) to Heatmap Cells
In SciChart.js v3 and above, you can now add data labels (text labels) to heatmap cells. To do this, you specify the HeatmapRenderableSeries.dataLabels property. Data Labels will automatically hide if the cell size is too small. If you can't see a data label, zoom in to ensure that it shows.
// ...
const heatmapSeries = new UniformHeatmapRenderableSeries(wasmContext, {
    dataSeries: heatmapDataSeries,
    colorMap: heatmapColorMap,
    dataLabels: {
        style: {
            fontFamily: "Arial",
            fontSize: 16,
        },
        color: appTheme.ForegroundColor
    }
});
Max Heatmap Size and Tiling Heatmaps
In SciChart.js the maximum heatmap size (NxM size of the 2-dimensional array) is determined by WebGL gl.MAX_TEXTURE_SIZE. This will be a different value depending on the GPU hardware, the browser and operating system. On a Windows PC Running in Chrome gl.MAX_TEXTURE_SIZE is 16,384 x 16,384 but could be as low as 2048 x 2048 on other devices.
For viewing massive heatmaps, SciChart.js allows tiling of heatmaps by placing multiple UniformHeatmapRenderableSeries onto the same SciChartSurface. Each heatmap can be positioned using xStart, xStep, yStart, yStep constructor parameters. This allows you to render very large datasets in browser and is how one of our users achieved this output: medical imaging using SciChart's heatmap feature.
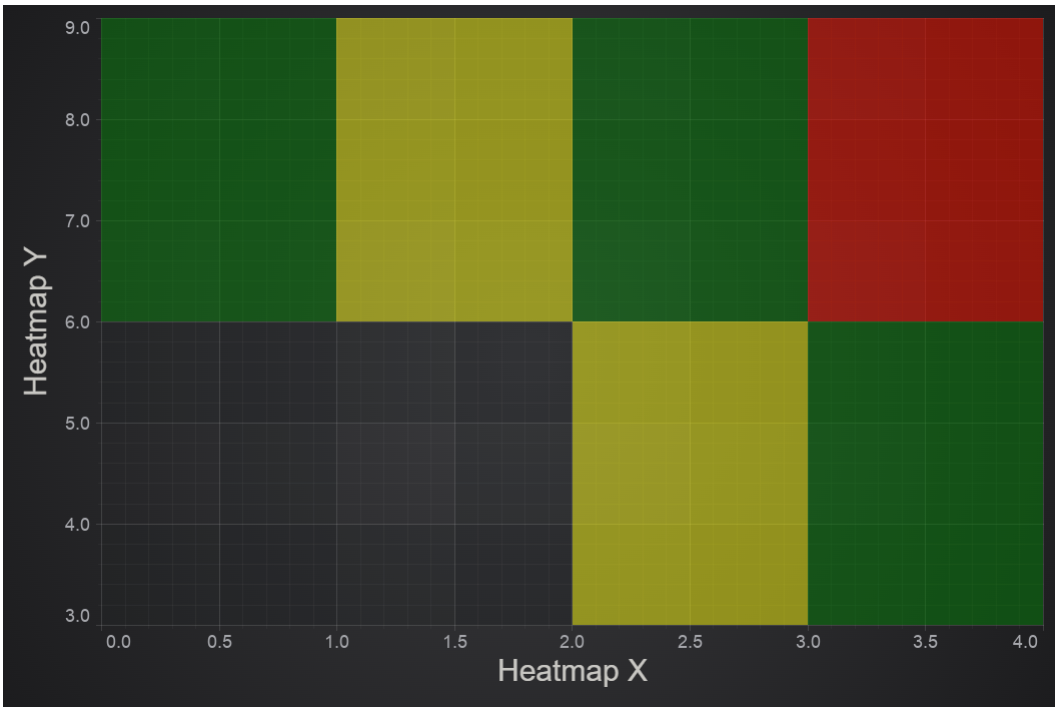
How to insert gaps (transparent cells) in heatmap using NaN
This section describes how to insert transparent cells (gaps, not a number, NaNs, null cells, empty cells) into UniformHeatmapRenderableSeries📘. In order to insert gaps we need to add NaN values into zValues array and to set flag dataSeries.hasNaNs = true.
For UniformHeatmapDataSeries📘 this can be done by passing zValue options📘 in the constructor.
A similar approach works for Non-Uniform Heatmap Chart Type.
    const { sciChartSurface, wasmContext } = await SciChartSurface.create(divElementId2);
    sciChartSurface.xAxes.add(
        new NumericAxis(wasmContext, {
            axisTitle: "Heatmap X"
        })
    );
    sciChartSurface.yAxes.add(
        new NumericAxis(wasmContext, {
            axisTitle: "Heatmap Y",
            axisAlignment: EAxisAlignment.Left
        })
    );

    const gradientStops = [
        { offset: 0, color: "yellow" },
        { offset: 0.5, color: "green" },
        { offset: 1, color: "red" }
    ];
    const colorMap = new HeatmapColorMap({
        minimum: 1,
        maximum: 3,
        gradientStops
    });

    const zValues = [
        [NaN, NaN, 1, 2],
        [2, 1, 2, 3]
    ];

    const dataSeries = new UniformHeatmapDataSeries(wasmContext, {
        xStart: 0,
        xStep: 1,
        yStart: 3,
        yStep: 3,
        zValues
    });
    dataSeries.hasNaNs = true;

    const heatmapSeries = new UniformHeatmapRenderableSeries(wasmContext, {
        opacity: 0.5,
        dataSeries,
        colorMap
    });

    sciChartSurface.renderableSeries.add(heatmapSeries);
    return { sciChartSurface, wasmContext };
This is the result