Tutorial 01 - Setting up a project with scichart-react and config object
In this tutorial we will show you how to setup a new npm project with scichart.js and scichart-react.
React requires a little setup so we'd like to do this boilerplate once, which will be used as a basis for future tutorials.
We'll show you how to create a new JavaScript project and adding scichart and scichart-react libraries as dependencies to it. Then how to use webpack to initialize the application and show an empty chart.
Finally, we'll show how to show a static chart using the config property which uses the JSON Builder API to provide a chart definition.
Source code for this tutorial can be found in SciChart.JS.Examples repo
What is SciChart-React?
scichart-react is a free open source React Chart component for use with scichart.js. This simplifies the development of React Charts by handling initialisation, deletion and lifecycle of the chart and allows multiple options for creating simple to advanced options. Find out more at the links below:
- Blog: Introducing scichart-react
- github.com/abtsoftware/scichart-react
- npmjs.com/package/scichart-react
How to Setup A Project with SciChart-React
Before starting the tutorial, lets briefly go over project initialization for React, SciChart.js and scichart-react.
Creating the Project
Go ahead and open up VSCode or WebStorm and enter the terminal. Create a directory to host your tutorial, and type in the following command.
- Initialising an npm project
npm init
Next, install packages. We will need react-dom, scichart and scichart-react
- Initialising an npm project
npm install scichart scichart-react react react-dom
We will also need Webpack for npm start, and copying wasm files
- Initialising an npm project
npm install --save-dev webpack webpack-dev-server webpack-cli copy-webpack-plugin
Finally, Babel is required for JSX files
- Initialising an npm project
npm install --save-dev @babel/core
npm install --save-dev @babel/preset-react
npm install --save-dev babel-loader
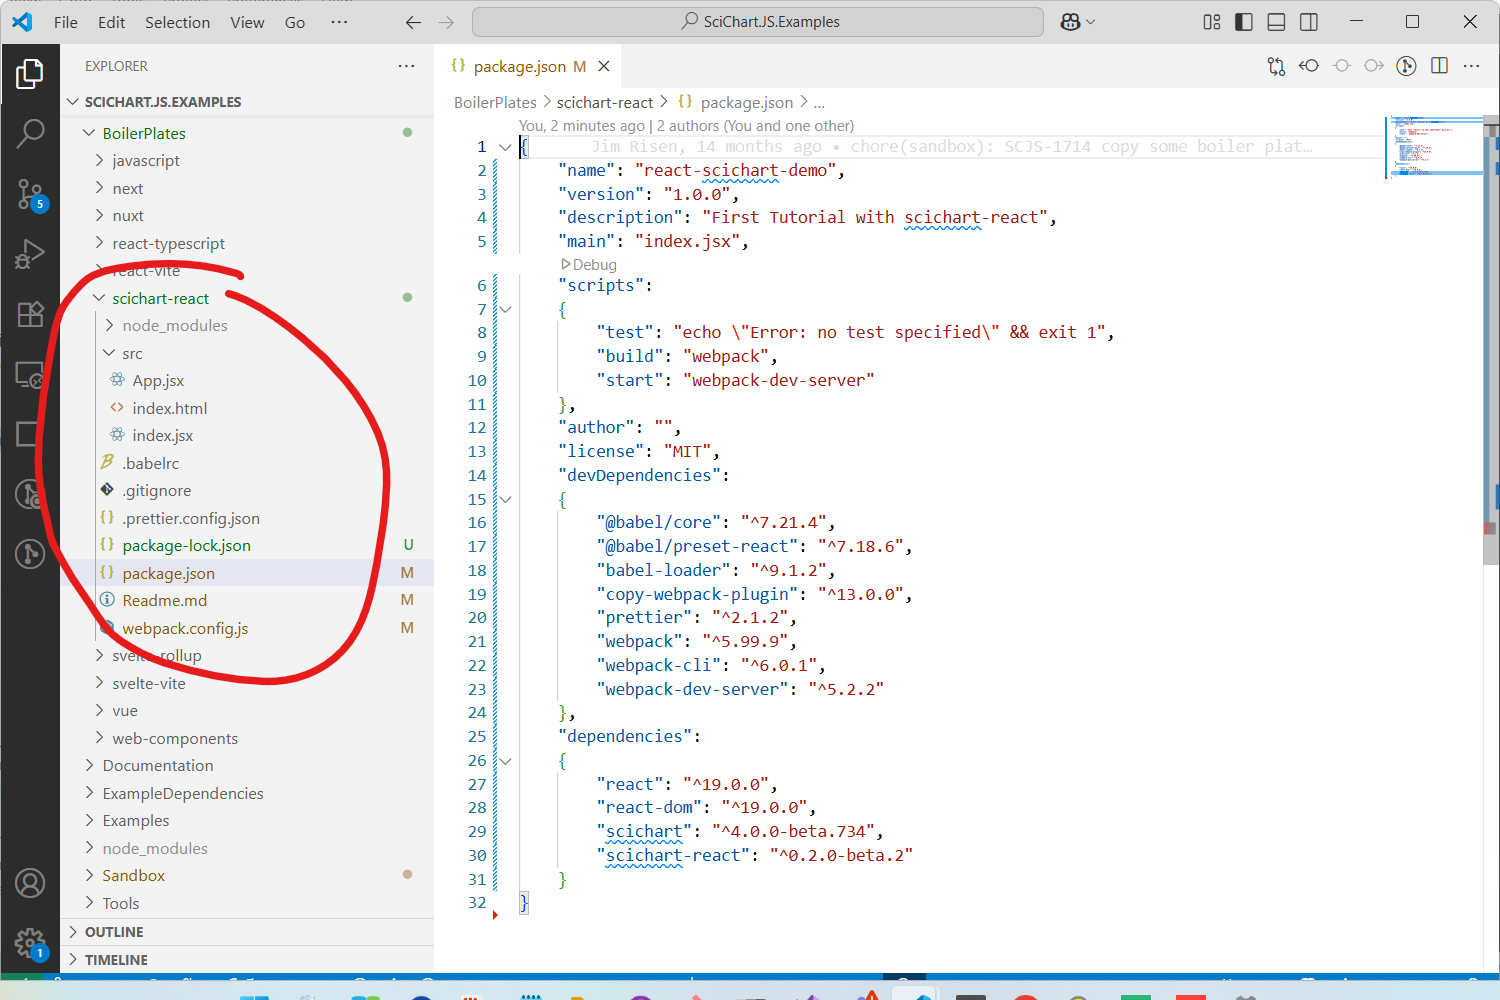
By the time you've completed this your package.json should look like this:
- package.json
{
  "name": "react-scichart-demo",
  "version": "1.0.0",
  "description": "First Tutorial with scichart-react",
  "main": "index.jsx",
  "scripts": {
    "test": "echo \"Error: no test specified\" && exit 1",
    "build": "webpack",
    "start": "webpack-dev-server"
  },
  "author": "",
  "license": "MIT",
  "devDependencies": {
    "@babel/core": "^7.21.4",
    "@babel/preset-react": "^7.18.6",
    "babel-loader": "^9.1.2",
    "copy-webpack-plugin": "^13.0.0",
    "prettier": "^2.1.2",
    "webpack": "^5.99.9",
    "webpack-cli": "^6.0.1",
    "webpack-dev-server": "^5.2.2"
  },
  "dependencies": {
    "react": "^19.0.0",
    "react-dom": "^19.0.0",
    "scichart": "^5.0.0-alpha.135",
    "scichart-react": "^0.2.0-beta.2"
  }
}
Setting up Webpack
Whichever package bundler you use, some configuration will need to be done to setup the project for React and loading JSX (or TSX if you use Typescript).
You'll have to add a webpack.config.js to your project which needs to load JSX/JS files, compiled to bundle.js and copy scichart wasm files to the output.
- webpack.config.js
const path = require("path");
const CopyPlugin = require("copy-webpack-plugin");
const webpack = require("webpack");

module.exports = {
  mode: "production",
  entry: "./src/index.jsx",
  performance: {
    hints: false,
  },
  module: {
    rules: [
      {
        test: /\.(js|jsx)$/,
        exclude: /node_modules/,
        use: {
          loader: "babel-loader",
        },
      },
    ],
  },
  resolve: {
    extensions: [".js", ".jsx"],
  },
  output: {
    filename: "bundle.js",
    path: path.resolve(__dirname, "build"),
  },
  plugins: [
    new CopyPlugin({
      patterns: [
        { from: "src/index.html", to: "" },
        // Required for scichart to load wasm files for 2D charts
        // Loading from CDN is also possible by calling SciChartSurface.loadWasmFromCDN()
        { from: "node_modules/scichart/_wasm/scichart2d.wasm", to: "" },
        // This one also needed to work in browsers without SIMD support
        { from: "node_modules/scichart/_wasm/scichart2d-nosimd.wasm", to: "" },
        // Optional: if including 3D charts copy these files
        { from: "node_modules/scichart/_wasm/scichart3d.wasm", to: "" },
        { from: "node_modules/scichart/_wasm/scichart3d-nosimd.wasm", to: "" },
      ],
    }),
  ],
  devServer: {
    client: {
      overlay: {
        warnings: false,
        errors: true,
      },
    },
  },
};
Note in particular the use of CopyPlugin (from copy-webpack-plugin) which copies scichart2d.wasm, scichart2d-nosimd.wasm and scichart3d.wasm, scichart3d-nosimd.wasm (optional for 3D charts) to the output directory.
Other methods of loading wasm and more detail is provided in the page Deploying Wasm (WebAssembly) files with your app. It's even possible to load wasm from our CDN and skip this step entirely for the purpose of learning.
Creating the code
This boilerplate/tutorial is currently optimised to work with React 19. Project templates with earlier versions of React (React 16, 18) as well as Electron are also demonstrated in the scichart-react repository on Github.
Let's go ahead and create the code for our first chart with scichart-react. Create a folder called /src and create index.html and index.jsx file.
- index.html
- index.jsx
<html lang="en-us">
  <head>
    <meta charset="utf-8" />
    <meta content="text/html; charset=utf-8" http-equiv="Content-Type" />
    <title>SciChart.js Tutorial 1</title>
    <script async type="text/javascript" src="bundle.js"></script>
    <style>
      body {
        font-family: "Arial";
      }
    </style>
  </head>
  <body>
    <div id="root"></div>
  </body>
</html>
import { createRoot } from "react-dom/client";
import App from "./App";
import React from "react";

function Main() {
  return (
    <React.StrictMode>
      <App />
    </React.StrictMode>
  );
}
const root = createRoot(document.getElementById("root"));
root.render(<Main />);
These two initialize the React DOM and load the root component <Main/> found in index.jsx.
Adding App.jsx and Creating the React Chart
Next, add an App.jsx file to the project. This is where we're going to initialize our SciChart.js chart using scichart-react.
- App.jsx
import {
SweepAnimation,
SciChartJsNavyTheme,
NumberRange,
EAxisType,
EChart2DModifierType,
ESeriesType,
EPointMarkerType,
} from "scichart";
import React from "react";
import { SciChartReact } from "scichart-react";
const chartConfig = {
surface: {
theme: new SciChartJsNavyTheme(),
title: "SciChart.js First Chart",
titleStyle: { fontSize: 22 },
},
// Create an XAxis and YAxis with growBy padding
xAxes: [
{
type: EAxisType.NumericAxis,
options: {
axisTitle: "X Axis",
growBy: new NumberRange(0.1, 0.1),
},
},
],
yAxes: [
{
type: EAxisType.NumericAxis,
options: {
axisTitle: "Y Axis",
growBy: new NumberRange(0.1, 0.1),
},
},
],
// Create a line series with some initial data
series: [
{
type: ESeriesType.LineSeries,
xyData: {
xValues: [0, 1, 2, 3, 4, 5, 6, 7, 8, 9],
yValues: [
0, 0.0998, 0.1986, 0.2955, 0.3894, 0.4794, 0.5646, 0.6442, 0.7173,
0.7833,
],
},
options: {
stroke: "steelblue",
strokeThickness: 3,
pointMarker: {
type: EPointMarkerType.Ellipse,
options: {
width: 11,
height: 11,
fill: "#fff",
},
},
animation: new SweepAnimation({
duration: 300,
fadeEffect: true,
}),
},
},
],
// Add some interaction modifiers to show zooming and panning
modifiers: [
{ type: EChart2DModifierType.MouseWheelZoom },
{
type: EChart2DModifierType.ZoomPan,
options: { enableZoom: true },
},
{ type: EChart2DModifierType.ZoomExtents },
],
};
const onInit = (initTemplate) => {
// After creation with the builder API, onInit allows you to access and modify the chart state
const sciChartSurface = initTemplate.sciChartSurface;
const wasmContext = sciChartSurface.webAssemblyContext2D;
// for example. adding extra series
// sciChartSurface.renderableSeries.add(new FastLineRenderableSeries(wasmContext, { ... options }));
};
function App() {
// LICENSING
// Commercial licenses set your license code here
// SciChartSurface.setRuntimeLicenseKey("YOUR_RUNTIME_KEY");
// to use WebAssembly and Data files from CDN instead of the same origin
// SciChartSurface.loadWasmFromCDN();
return (
<div className="App">
<header className="App-header">
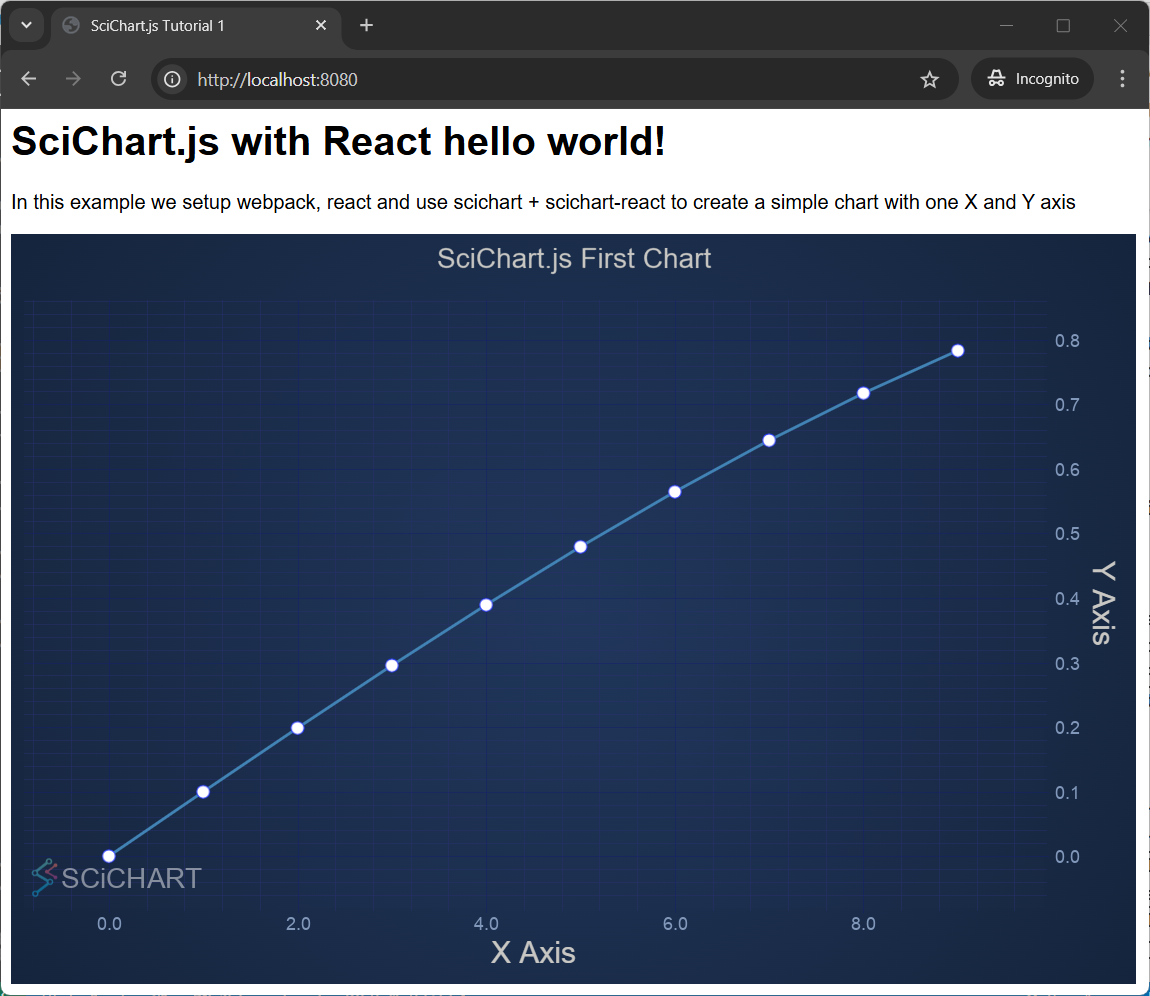
<h1>SciChart.js with React hello world!</h1>
<p>
In this example we setup webpack, react and use scichart +
scichart-react to create a simple chart with one X and Y axis
</p>
</header>
<SciChartReact
config={chartConfig}
onInit={onInit}
style={{ maxWidth: 900, height: 600 }}
/>
</div>
);
}
export default App;
The <SciChartReact /> component renders a single scichart chart. config is a prop which requires a JSON object matching the Builder API schema which can define your chart. Check the chartConfig in the code above.
Another option to create chart using standard API (not the Builder API) is to use onInit property.
Breaking down App.jsx
This example demonstrates how to build a basic chart using SciChart.js with React and the <SciChartReact /> component. SciChart.js is a powerful charting library for high-performance data visualization, and this code shows one way to initialize a chart using a configuration object with the Builder API in SciChart.
The <SciChartReact /> component from the SciChart library acts as a React wrapper for the SciChartSurface. It allows you to create charts using a configuration object: A declarative, JSON-like way to define the chart, or, an initialization function: A programmatic way to define the chart.
In this example, the chartConfig object contains all the details needed to set up the chart, such as axes, series, modifiers, and themes. You pass this configuration to the <SciChartReact config={chartConfig} /> component, and SciChart automatically builds the chart for you.
Using a chartConfig object is simple and quick, and ideal for creating static charts. However, if you wish to dynamically create or update charts and have better access to the SciChart API, you can also pass an initialization function to <SciChartReact />
Understanding chartConfig
config: is the JSON object which defines the chart. In this code we initialize a SciChartSurface📘 with the SciChartJsNavyTheme📘, set the title equal to "SciChart.js First Chart" and set titleStyle to have a fontSize of 22. We create a single XAxis and YAxis of type NumericAxis📘, with an axisTitle and set growBy - a property which allows you to set padding on the top/bottom of an axis when autofitting to the data.
We define a single series of ESeriesType.LineSeries📘 and pass some xyData with predefined xValues and yValues. Options to the series include stroke, strokeThickness, pointMarker (whch renders an Ellipse at each datapoint) and a SweepAnimation📘 which animates the chart on startup.
Finally, we add modifiers - or Chart Modifiers - behaviours which modify the chart such as zoomEChart2DModifierType.MouseWheelZoom📘, ZoomPan📘, and ZoomExtents📘. Further modifiers are possible which allow you to add tooltips, legends, selection and more.
This config object hydrates the chart and presents you with a static chart that you can interact with. Further modification of the chart is possible by adding an onInit callback to <SciChartReact /> which allows you to access the hydrated SciChartSurface instance.
Future tutorials will dig into the specifics of initializing and configuring charts, but this one serves to show you how to get a SciChart.js chart into React quickly.
The Output Result
If you run the application by typing npm start in the terminal, you should see this!
It's advisable to check out the SciChart.Js.Examples Github Repository and run the project under Boilerplates/scichart-react. You can use this as a basis for future projects with scichart-react and our next set of tutorials will be based on it. Happy coding!
A note about SciChartSurface.delete():
<SciChartReact /> automatically calls sciChartSurface.delete()📘, ensuring that all wasm memory is disposed on component unmount. This cascades and calls dataSeries.delete()📘 on all data currently in the chart. If you dynamically add/remove series however you will need to delete these as you go along. For more info see the article on Deleting DataSeries Memory.