Tutorial 01 - Setting up a npm Project with SciChart.js
Creating a New SciChart.js Project
In this tutorial we will create a simple line chart with SciChart.js. We'll show you how to create a new JavaScript project in VSCode and adding SciChart libraries as dependencies to it.
Source code for this tutorial can be found at our SciChart.Js.Examples Github Repository.
Pre-requisites
VSCode
If you haven't done so already go ahead and download VSCode from https://code.visualstudio.com/. We will be using this for tutorials, but you can equally use WebStorm or any other IDE or text editor of your choice.
NPM / Node.js
You will also need to have npm installed. You can get npm from here: https://docs.npmjs.com
Creating the Project
Go ahead and open up VSCode and enter the terminal. Create a directory to host your tutorial, and type in the following command.
Initialising an npm project
npm init
Choose defaults, I have named it tutorial1 and I want to use index.js for my package.json. SciChart.js supports both TypeScript and JavaScript ES6, however for the purposes of these tutorials we're going to be using plain JavaScript.
Installing SciChart via npm
SciChart.js is hosted on npm.org, so to install the package to your poject simply use the command npm install scichart.
Initialising an npm project
npm install scichart
Configuring Webpack
We're going to use webpack to make the smallest possible node.js JavaScript application for our tutorials. To install this, add the following commands.
Initialising an npm project
npm install --save-dev webpack
npm install --save-dev webpack-dev-server
npm install --save-dev webpack-cli
npm install --save-dev copy-webpack-plugin
Add Scripts to Package.json
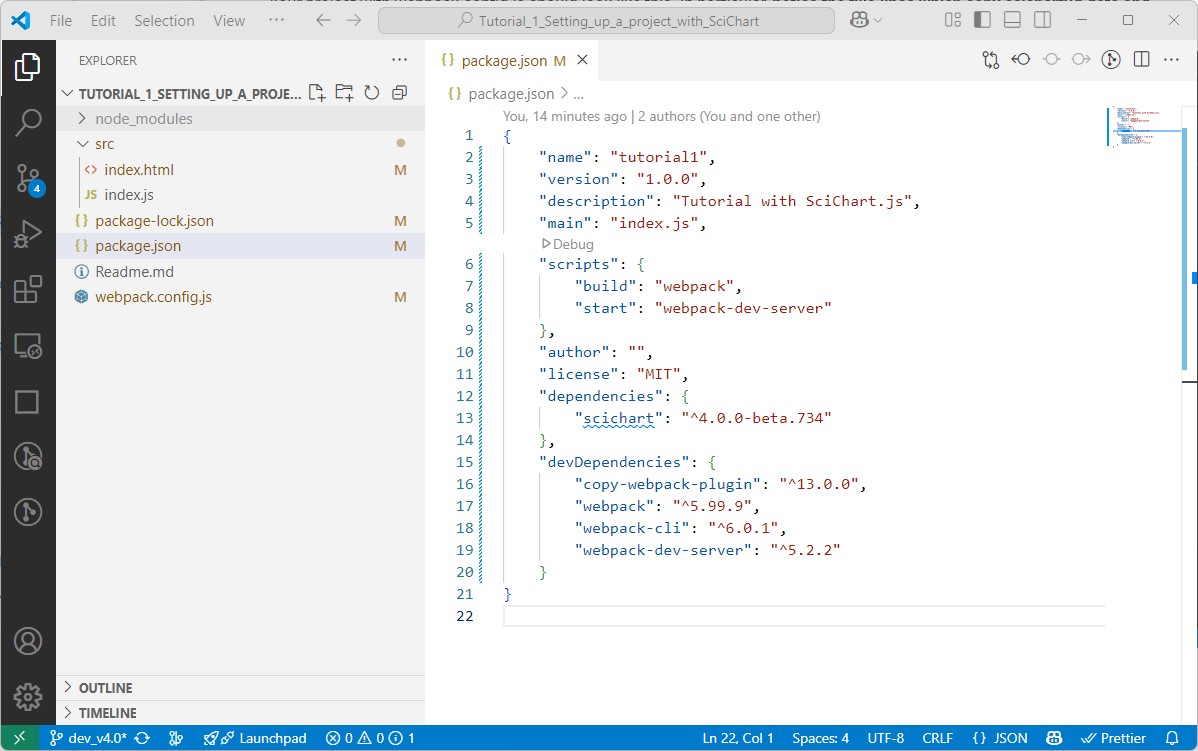
Our package.json should look something like this.
package.json
{
    "name": "tutorial1",
    "version": "1.0.0",
    "description": "Tutorial with SciChart.js",
    "main": "index.js",
    "scripts": {
        "build": "webpack",
        "start": "webpack-dev-server"
    },
    "author": "",
    "license": "MIT",
    "dependencies": {
        "scichart": "^5.0.0-alpha.135"
    },
    "devDependencies": {
        "copy-webpack-plugin": "^13.0.0",
        "webpack": "^5.99.9",
        "webpack-cli": "^6.0.1",
        "webpack-dev-server": "^5.2.2"
    }
}
Let's add a few more items to it so we can build the application.
Creating webpack.config.js
Add a file to your project called webpack.config.js, and paste in the following code.
Note, the following highlighted line is required to copy SciChart's WebAssembly file to your build directory.
webpack.config.js
const path = require("path");
const CopyPlugin = require("copy-webpack-plugin");

module.exports = {
    mode: "production",
    entry: "./src/index.js",
    performance: {
        hints: false
    },
    module: {
        rules: []
    },
    resolve: {
        extensions: [".js"]
    },
    output: {
        filename: "bundle.js",
        path: path.resolve(__dirname, "build")
    },
    plugins: [
        new CopyPlugin({
            patterns: [
                { from: "src/index.html", to: "" },
                { from: "node_modules/scichart/_wasm/scichart2d.wasm", to: "" },
                { from: "node_modules/scichart/_wasm/scichart2d-nosimd.wasm", to: "" }
            ]
        })
    ]
};
Your project with webpack.config.js should look like this. In particular, notice the lines which copy scichart2d.wasm, scichart2d-nosimd.wasm to the output folder. Read more about SIMD here.
Creating Index.js / Index.html
We're going to create a simple Index.js / Index.html. Create and add these two files to the root of your project, and add this code.
index.html
<html lang="en-us">
    <head>
        <meta charset="utf-8" />
        <meta content="text/html; charset=utf-8" http-equiv="Content-Type" />
        <link rel="icon" href="data:,">
        <title>SciChart.js Tutorial 1</title>
        <script async type="text/javascript" src="bundle.js"></script>
        <style>
            body { font-family: 'Arial'}
        </style>
    </head>
    <body>
        <h1>Hello SciChart.js world!</h1>
        <p>In this example we setup webpack, scichart and create a simple chart with one X and Y axis</p>

        <!-- the Div where the SciChartSurface will reside -->
        <div id="scichart-root" style="width: 800px; height: 600px;"></div>
    </body>
</html>
SciChart.js simply needs a Div in your application to host the chart. We've added one above and given it the id=scichart-root.
Next we're going to add index.js, where we initialize and create a SciChartSurface.
index.js
import { SciChartSurface, NumericAxis } from "scichart";

async function initSciChart() {
  // LICENSING //
  // For community or trial usage, SciChart.js works out of the box

  // For commercial use of SciChart, you need a license.
  // Purchased license keys can be viewed at https://www.scichart.com/my-account
  //
  // e.g.
  // Set your license code here
  // SciChartSurface.setRuntimeLicenseKey("YOUR_RUNTIME_KEY");
  //
  // Also, once activated (trial or paid license) having the licensing wizard open on your machine
  // will mean any or all applications you run locally will be fully licensed.

  // Create the SciChartSurface in the div 'scichart-root'
  // The SciChartSurface, and webassembly context 'wasmContext' are paired. This wasmContext
  // instance must be passed to other types that exist on the same surface.
  const { sciChartSurface, wasmContext } = await SciChartSurface.create(
    "scichart-root"
  );

  // Create an X,Y Axis and add to the chart
  const xAxis = new NumericAxis(wasmContext);
  const yAxis = new NumericAxis(wasmContext);

  sciChartSurface.xAxes.add(xAxis);
  sciChartSurface.yAxes.add(yAxis);

  // That's it! You just created your first SciChartSurface!
}

initSciChart();
The SciChart.js API is pretty simple. In the code sample above we declare an instance of a SciChartSurface like this.
Declaring a SciChartSurface
  const { sciChartSurface, wasmContext } = await SciChartSurface.create(
    "scichart-root"
  );
This function returns a SciChartSurface instance and a wasmContext (WebAssembly Context). You will need this context for all chart parts related to this chart.
Next, we add a single X,Y Axis. We do this by creating a new NumericAxis, and adding it to the SciChartSurface.xAxes📘 and SciChartSurface.yAxes📘 collections.
Declaring a SciChartSurface
// Create an X,Y Axis and add to the chart
const xAxis = new NumericAxis(wasmContext);
const yAxis = new NumericAxis(wasmContext);

sciChartSurface.xAxes.add(xAxis);
sciChartSurface.yAxes.add(yAxis);
Don't forget you will need to add a license to use SciChart.js commercially (for community licensing, nothing needs to be done). You can do this once in code as follows. You can apply a license by following instructions at www.scichart.com/licensing-scichart-js
That's it! You have just created your first SciChartSurface using SciChart.js!
Building and Running the App
Ok now that we've set that all up, building and running should be pretty easy!
In the command line, simply type the following command.
Running the Tutorial
npm start
Now visit http://localhost:8080 in your browser and voila! You should see a SciChart.js Chart!

Source code for this tutorial can be found at our SciChart.Js.Examples Github Repository.
A Note on Licensing SciChart.
The SciChart.js control comes with a community license which is watermarked. This can be used for commercial trial use for a reasonable time period.
For commercial licenses, a license key can be applied following the instructions at www.scichart.com/licensing-scichart-js.