Tutorial 10 - Vertical Charts
In the previous tutorial we explained how to link multiple charts using SciChart.js. In this tutorial, we are going to show you how to add a Vertical Chart.
Source code for this tutorial can be found at SciChart.JS.Examples Github Repository
Adding a Chart
First let's create a simple Line Chart. In this example we generate a data set for sine wave and add SciChartSurface with two NumericAxis📘 and FastLineRenderableSeries📘 to produce the Line Chart.
- index.js
- index.html
import {
  SciChartSurface,
  NumericAxis,
  NumberRange,
  XyDataSeries,
  FastLineRenderableSeries,
} from "scichart";

async function initSciChart() {
  const { wasmContext, sciChartSurface } = await SciChartSurface.create(
    "scichart-root"
  );

  // Generate a data set for sine wave
  const xValues = [];
  const yValues = [];
  for (let i = 0; i <= 100; i++) {
    const x = 0.1 * i;
    xValues.push(x);
    yValues.push(Math.sin(x));
  }

  sciChartSurface.xAxes.add(
    new NumericAxis(wasmContext, {
      axisTitle: "X Axis",
      growBy: new NumberRange(0.1, 0.1),
    })
  );

  sciChartSurface.yAxes.add(
    new NumericAxis(wasmContext, {
      axisTitle: "Y Axis",
      growBy: new NumberRange(0.1, 0.1),
    })
  );

  sciChartSurface.renderableSeries.add(
    new FastLineRenderableSeries(wasmContext, {
      dataSeries: new XyDataSeries(wasmContext, { xValues, yValues }),
      stroke: "orange",
    })
  );
}

initSciChart();
<html lang="en-us">
<head>
<meta charset="utf-8" />
<meta content="text/html; charset=utf-8" http-equiv="Content-Type" />
<title>SciChart.js Tutorial 10 - Vertical Charts</title>
<script async type="text/javascript" src="bundle.js"></script>
<style>
body {
font-family: "Arial";
}
</style>
</head>
<body>
<h1>Hello SciChart.js world!</h1>
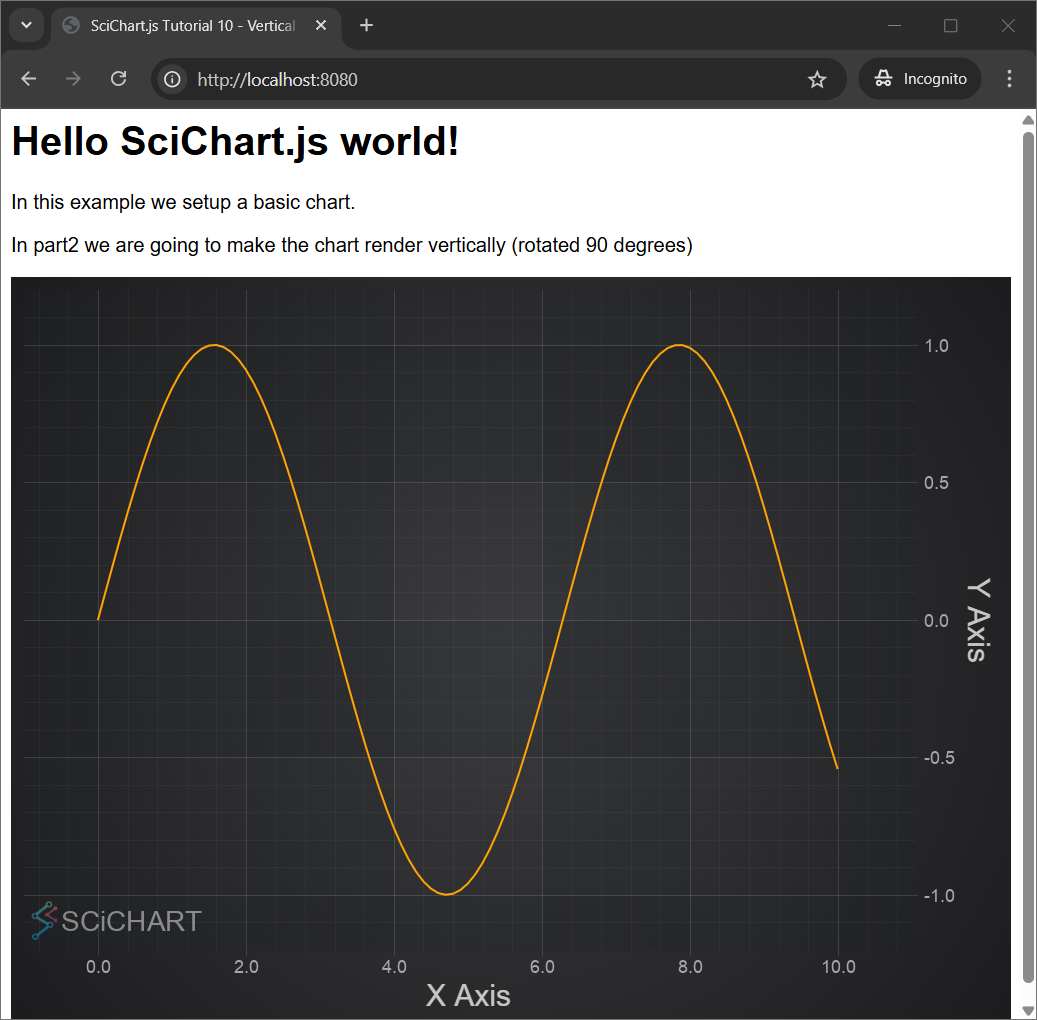
<p>In this example we setup a basic chart.</p>
<p>
In part2 we are going to make the chart render vertically (rotated 90
degrees)
</p>
<!-- the Div where SciChartSurface will reside -->
<div id="scichart-root" style="width: 800px; height: 600px"></div>
</body>
</html>
This gives us this chart:
Making the Chart Vertical
In fact, just setting xAxis.axisAlignment📘 to EAxisAlignment.Left📘 or Right and yAxis.axisAlignment📘 to EAxisAlignment.Top📘 or EAxisAlignment.Bottom makes the chart vertical.
Moreover if the axes orientation needs to be inverted there is axis.flippedCoordinates📘 property on AxisCore📘 class.
In order to make the chart interactive we add chart modifiers such as ZoomPanModifier, ZoomExtentsModifier, MouseWheelZoomModifier and RolloverModifier.
- Part2 index.js
- Part2 index.html
import {
  SciChartSurface,
  NumericAxis,
  NumberRange,
  XyDataSeries,
  FastLineRenderableSeries,
  EAxisAlignment,
  ZoomPanModifier,
  ZoomExtentsModifier,
  MouseWheelZoomModifier,
  RolloverModifier
} from "scichart";

async function initSciChart() {
  const { wasmContext, sciChartSurface } = await SciChartSurface.create(
    "scichart-root"
  );

  // Generate a data set for sine wave
  const xValues = [];
  const yValues = [];
  for (let i = 0; i <= 100; i++) {
    const x = 0.1 * i;
    xValues.push(x);
    yValues.push(Math.sin(x));
  }

  // Make the chart vertical by setting X Axis Alignment to Left or Right
  sciChartSurface.xAxes.add(
    new NumericAxis(wasmContext, {
      axisTitle: "X Axis",
      growBy: new NumberRange(0.1, 0.1),
      axisAlignment: EAxisAlignment.Left
    })
  );

  // Make the chart vertical by setting Y Axis Alignment to Top or Bottom
  sciChartSurface.yAxes.add(
    new NumericAxis(wasmContext, {
      axisTitle: "Y Axis",
      growBy: new NumberRange(0.1, 0.1),
      axisAlignment: EAxisAlignment.Top,
      // Flip the axis orientation with this property
      flippedCoordinates: true,
    })
  );

  sciChartSurface.renderableSeries.add(
    new FastLineRenderableSeries(wasmContext, {
      dataSeries: new XyDataSeries(wasmContext, { xValues, yValues }),
      stroke: "orange",
    })
  );

  // Add some interactivity modifiers. Everything is transposed in a vertical chart
  // so zoom/pan and rollover works vertically
  sciChartSurface.chartModifiers.add(new ZoomPanModifier());
  sciChartSurface.chartModifiers.add(new ZoomExtentsModifier());
  sciChartSurface.chartModifiers.add(new MouseWheelZoomModifier());
  sciChartSurface.chartModifiers.add(new RolloverModifier());
}

initSciChart();
<html lang="en-us">
<head>
<meta charset="utf-8" />
<meta content="text/html; charset=utf-8" http-equiv="Content-Type" />
<title>SciChart.js Tutorial 10 - Vertical Charts</title>
<script async type="text/javascript" src="bundle.js"></script>
<style>
body {
font-family: "Arial";
}
</style>
</head>
<body>
<h1>Hello SciChart.js world!</h1>
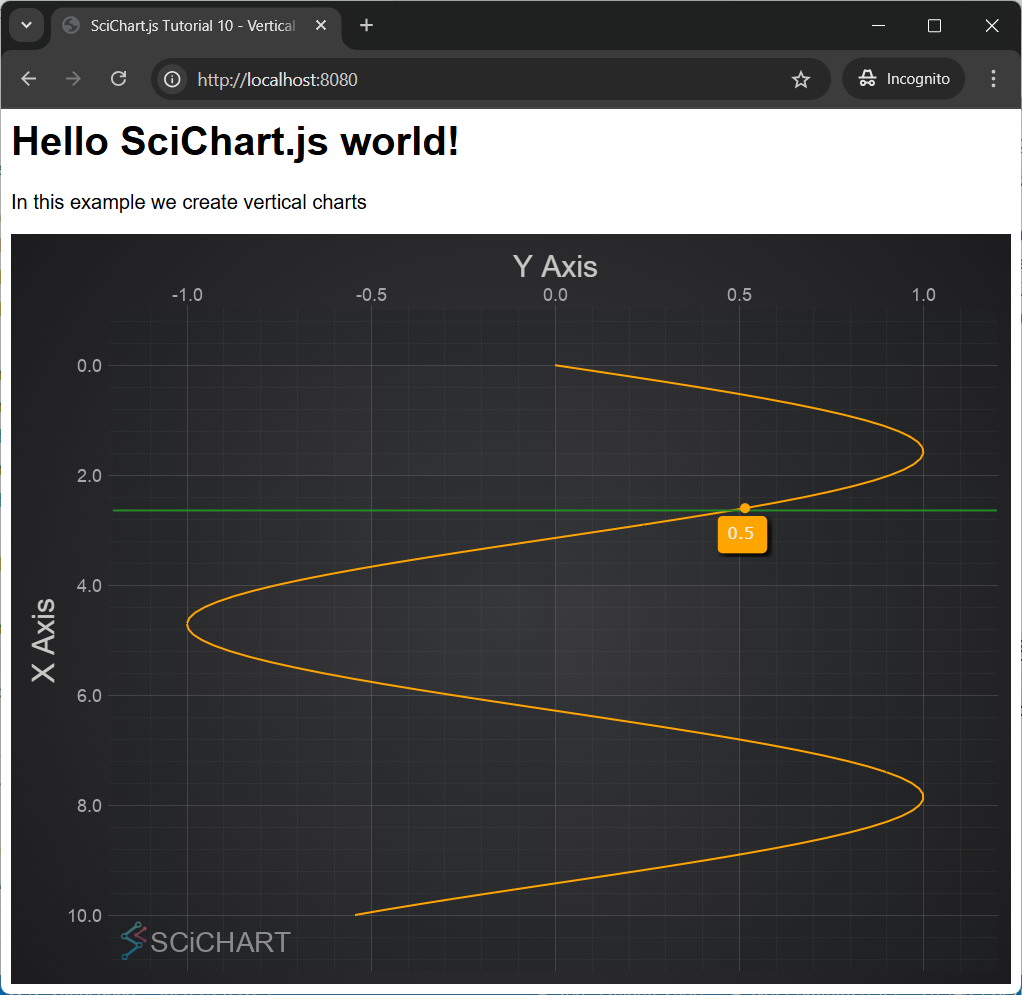
<p>In this example we create vertical charts (Part2)</p>
<!-- the Div where SciChartSurface will reside -->
<div id="scichart-root" style="width: 800px; height: 600px"></div>
</body>
</html>
This gives us the Vertical Chart:
Further Reading
Here is related documentation for further reading: