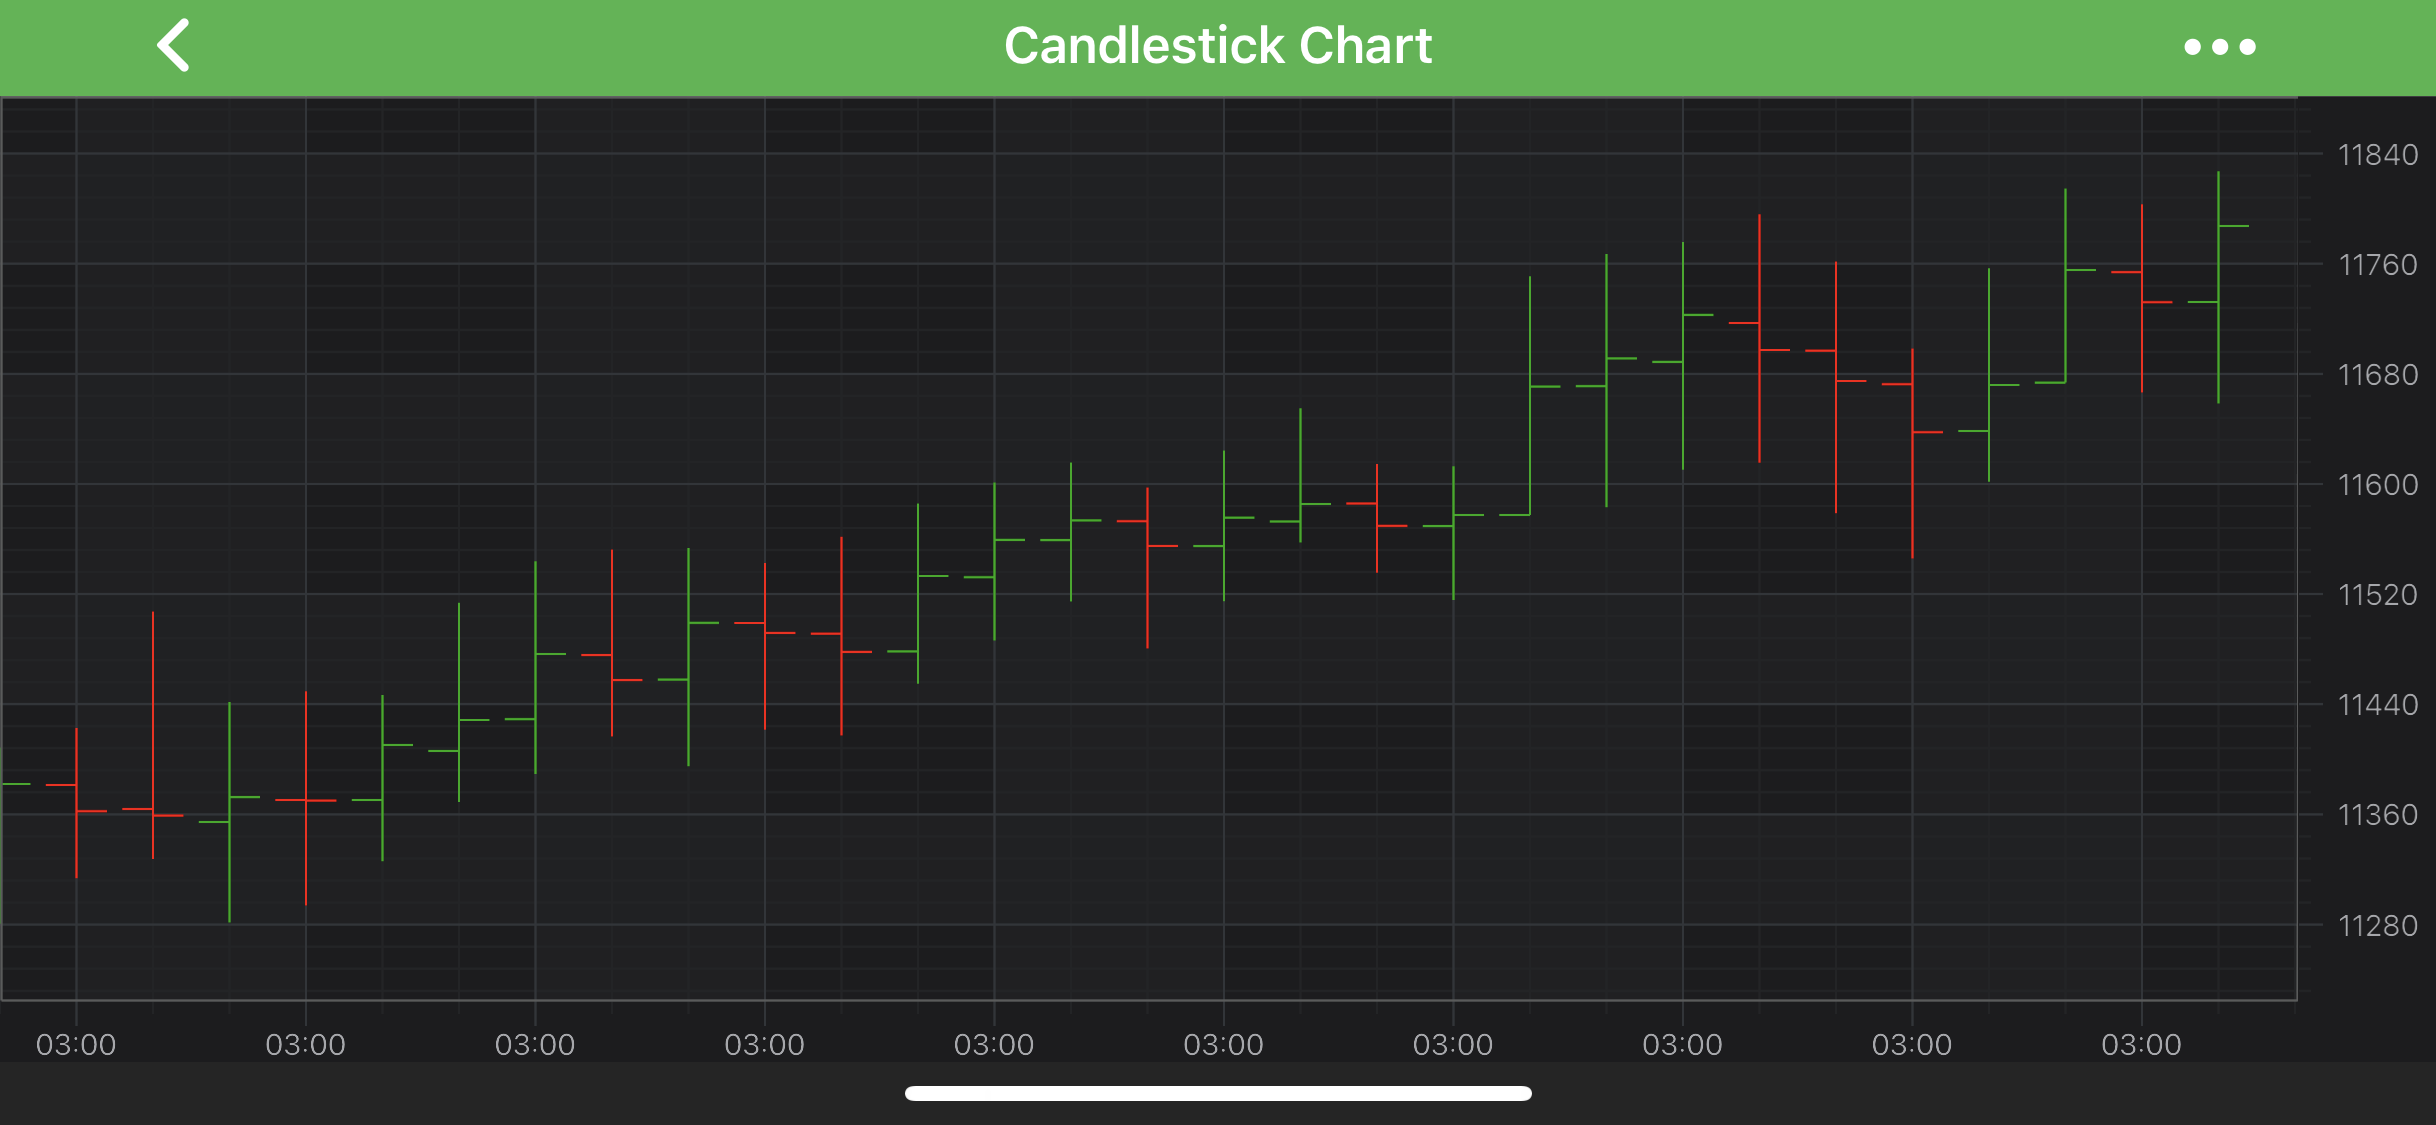
The OHLC Series Type
The OHLC series are provided by the FastOhlcRenderableSeries type. This accepts data (X, Open, High, Low, Close) from a OhlcDataSeries<TX,TY> and renders OHLC bar at each X-Value coordinate.
Note
For more info about OhlcDataSeries<TX,TY>, as well as other DataSeries types in SciChart, see the DataSeries API article.
Note
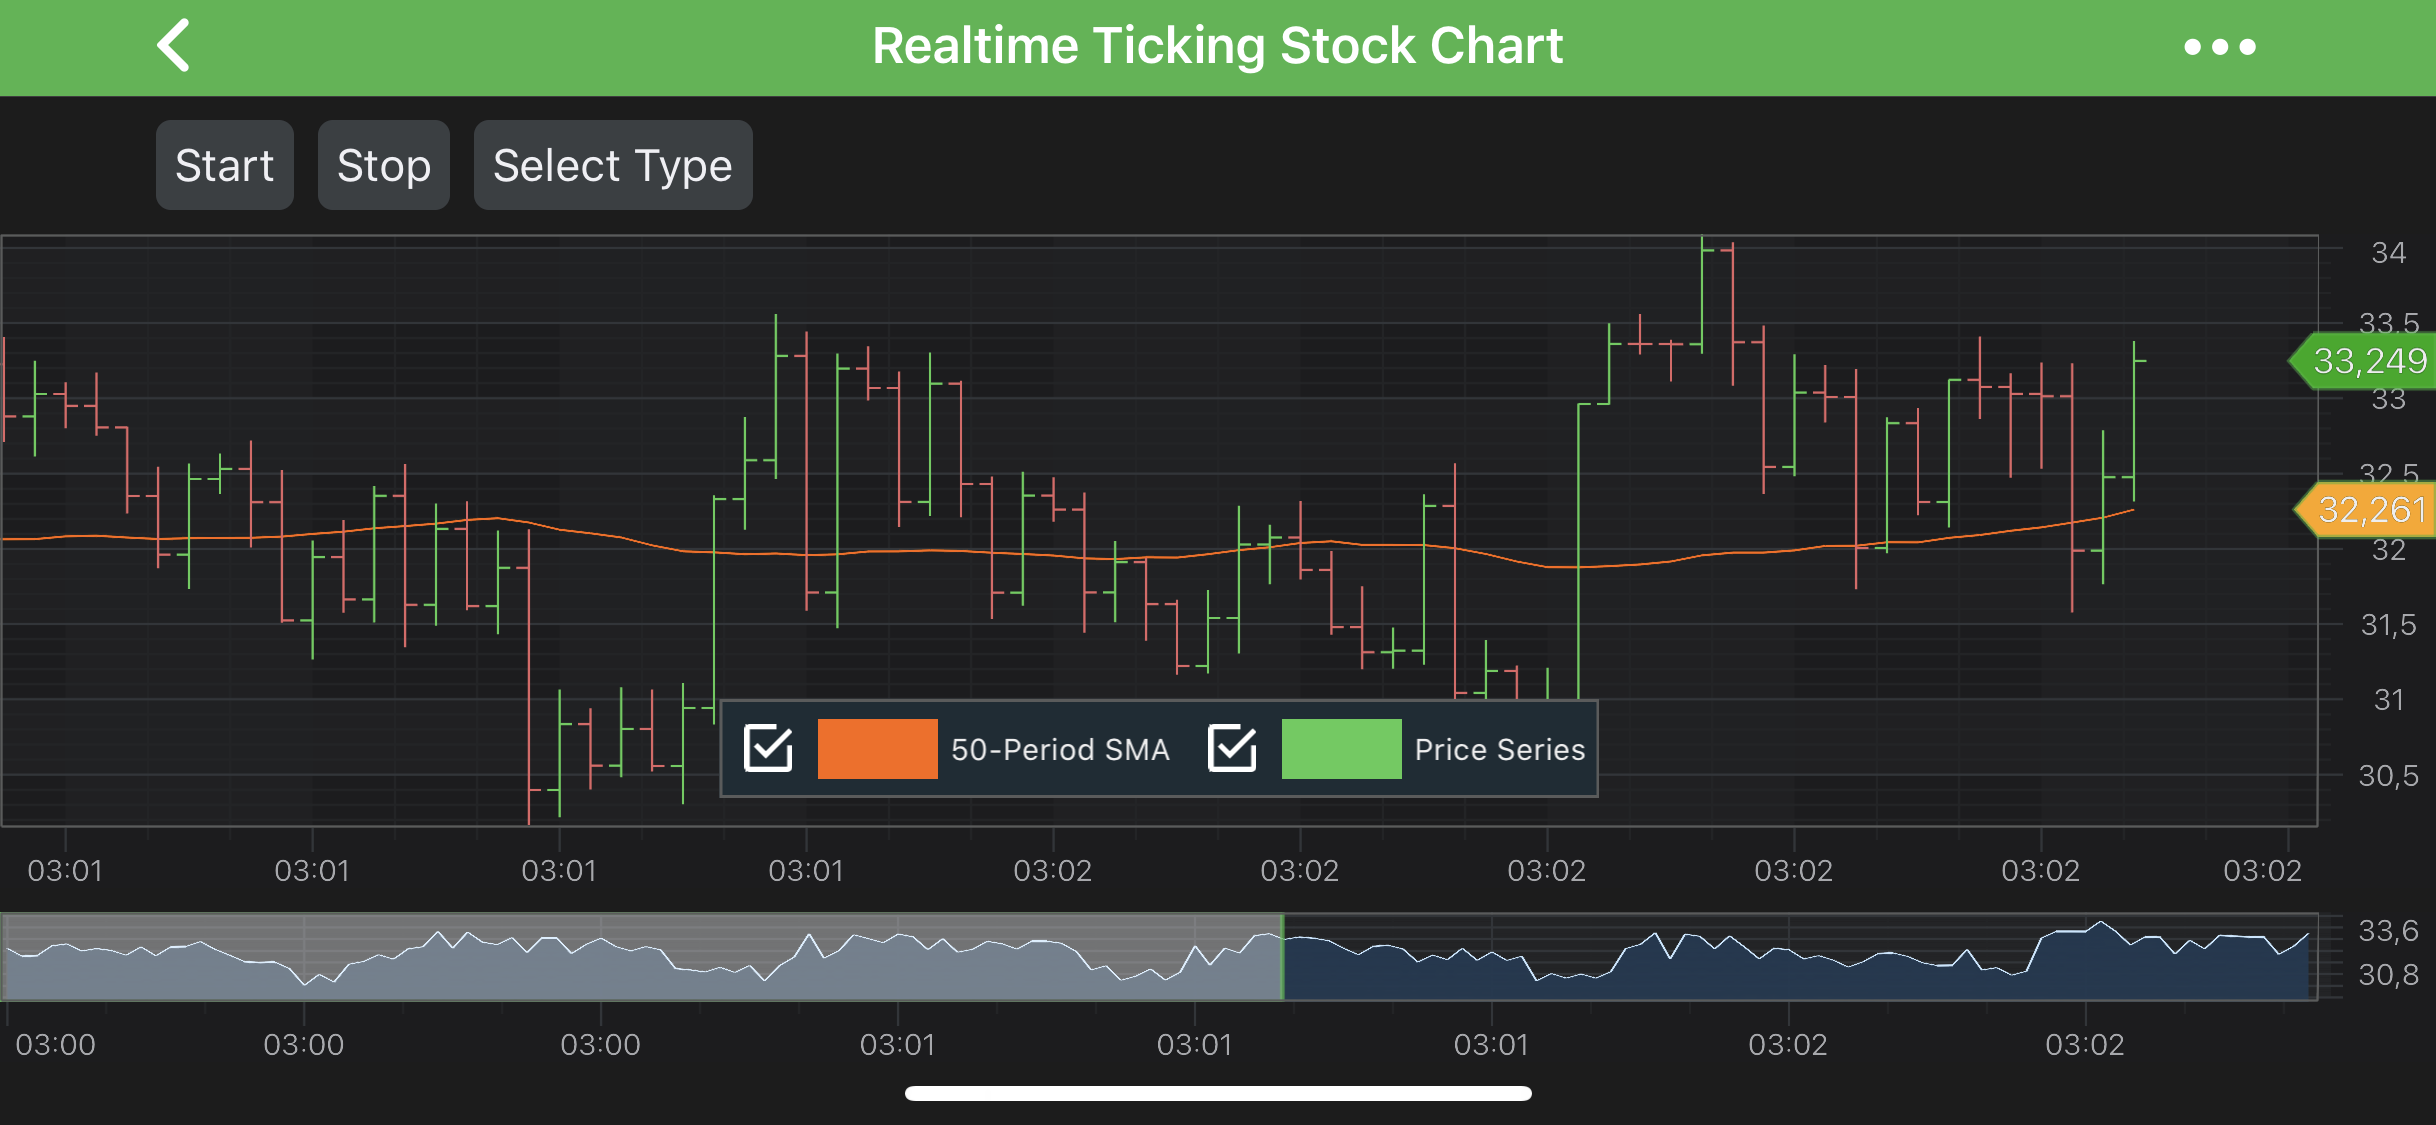
Examples of the OHLC Series can be found in the SciChart Android Examples Suite as well as on GitHub:
The FastOhlcRenderableSeries is very much alike the FastCandlestickRenderableSeries class. It allows to specify StrokeUp and StrokeDown pens as well as relative DataPointWidth, which will be applied to every bar. Mentioned settings can be accessed via the following properties:
- strokeUpStyle - applied to bars when Close <= Open.
- strokeDownStyle - applied to bars when Close > Open.
- dataPointWidth - specifies how much space a single bar occupies, varying from 0 to 1 (when columns are conjoined).
Note
To learn more about Pens and Brushes and how to utilize them, please refer to the PenStyle, BrushStyle and FontStyle article.
Note
In multi axis scenarios, a series has to be assigned to particular X and Y axes. This can be done passing the axes IDs to the xAxisId, yAxisId properties.
Create an OHLC Series
To create an OHLC Series, use the following code:
@Override
protected void initExample(@NonNull SciChartSurface surface) {
    final IOhlcDataSeries<Double, Double> dataSeries = new OhlcDataSeries<>(Double.class, Double.class);
    dataSeries.append(0.0, 0.0, 1.0, 0.0, 1.0);
    dataSeries.append(1.0, 1.0, 5.0, 0.0, 4.0);
    dataSeries.append(2.0, 3.0, 5.0, 0.0, 0.0);

    final FastOhlcRenderableSeries ohlcSeries = new FastOhlcRenderableSeries();

    ohlcSeries.setDataSeries(dataSeries);

    ohlcSeries.setStrokeDownStyle(new SolidPenStyle(Color.RED, true, 1f, null));
    ohlcSeries.setStrokeUpStyle(new SolidPenStyle(Color.GREEN, true, 1f, null));

    UpdateSuspender.using(surface, () -> {
        Collections.addAll(surface.getXAxes(), new NumericAxis(requireContext()));
        Collections.addAll(surface.getYAxes(), new NumericAxis(requireContext()));

        Collections.addAll(surface.getRenderableSeries(), ohlcSeries);
    });
}
OHLC Series Features
OHLC Series also has some features similar to other series, such as:
Render a Gap in an OHLC Series
It's possible to render a Gap in OHLC series, by passing a data point with a NaN as the Open, High, Low, Close values. Please refer to the RenderableSeries APIs article for more details.
Specify Color for Individual Bars
In SciChart, you can draw each bar of the OHLC Series with different colors using the PaletteProvider API. To Use palette provider for OHLC Series - a custom IStrokePaletteProvider has to be provided to the paletteProvider property. Please refer to the PaletteProvider API article for more info.