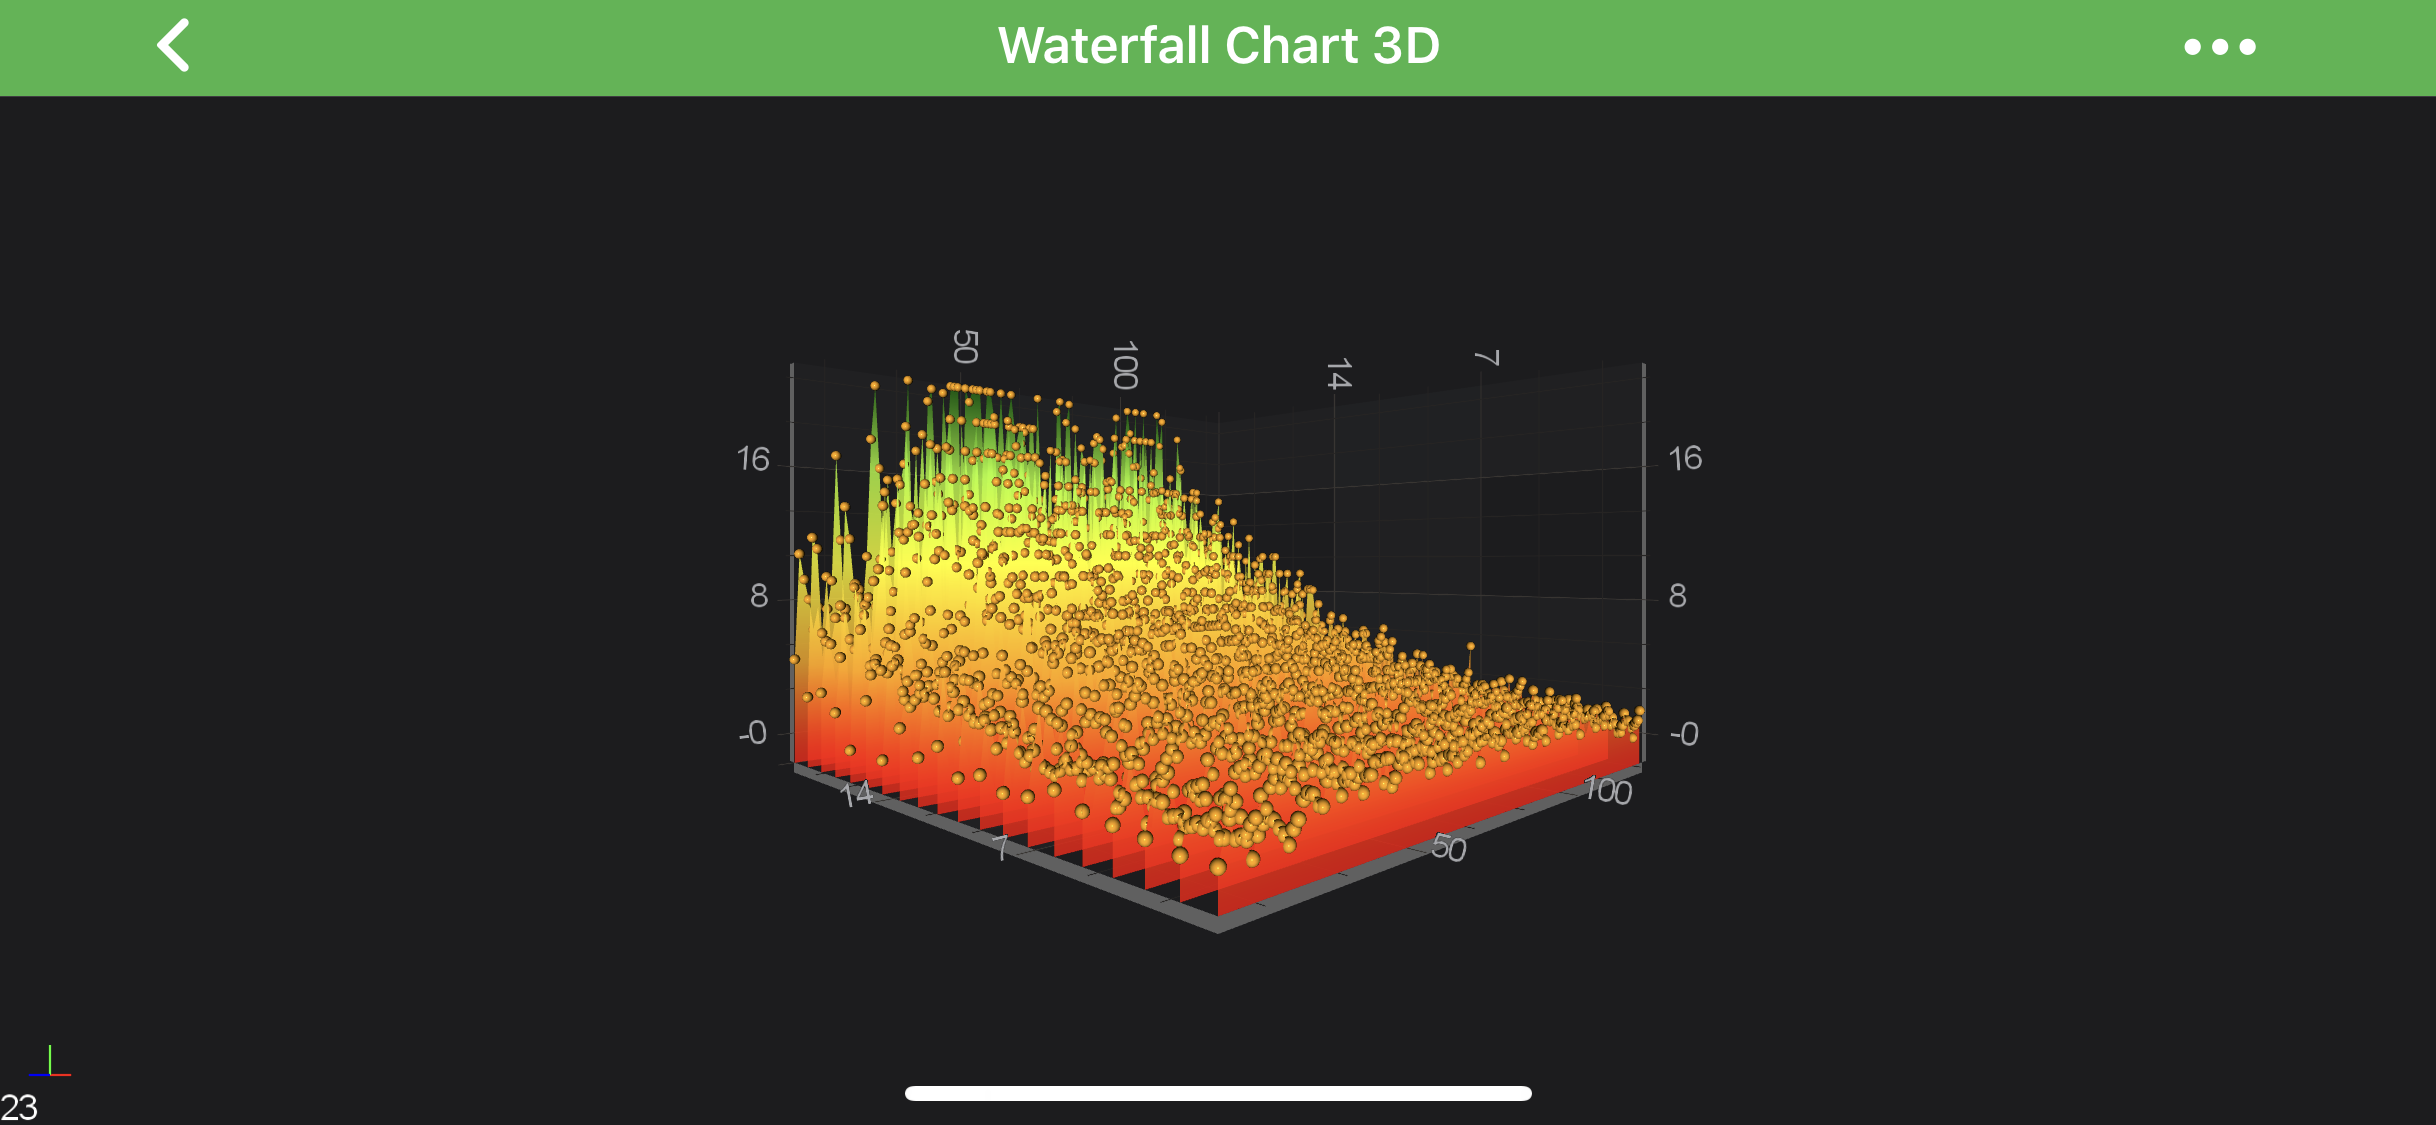
The Waterfall 3D Chart Type
The Waterfall Chart renders a two-dimensional array as a series of slices. In SciChart it's defined by the WaterfallRenderableSeries3D class and provides a number of configurable chart types in SciChart 3D. As an example, it can be used for the following:
- dynamic updating slices for visualizing spectra (Acoustic or radio frequency domain data)
- volumetric slices
- optional PointMarkers at data-points.
- and more...
Note
Examples of the Waterfall 3D Series can be found in the SciChart Android Examples Suite as well as on GitHub:
In the Surface Mesh 3D Series, the data is stored in the WaterfallDataSeries3D<TX,TY,TZ>.
This represents a 2-dimensional grid, typically of type double.
Some important points which is must to know while configuring the Waterfall Series:
- The double values which are stored in the WaterfallDataSeries3D<TX,TY,TZ> correspond to the heights on the chart [
Y-Axis]. They are transformed into chart World Coordinates via the yAxis. - The
ZandXData-Value are defined by the startX, stepX, startZ and stepZ properties on UniformGridDataSeries3D<TX,TY,TZ>. These are transformed into World Coordinates via the xAxis and zAxis respectively. - The Color of each slice and outlines are define by the MeshColorPalette via the following properties:
Read on to learn more about Applying Palettes to the Waterfall
Create a Surface Mesh Series 3D
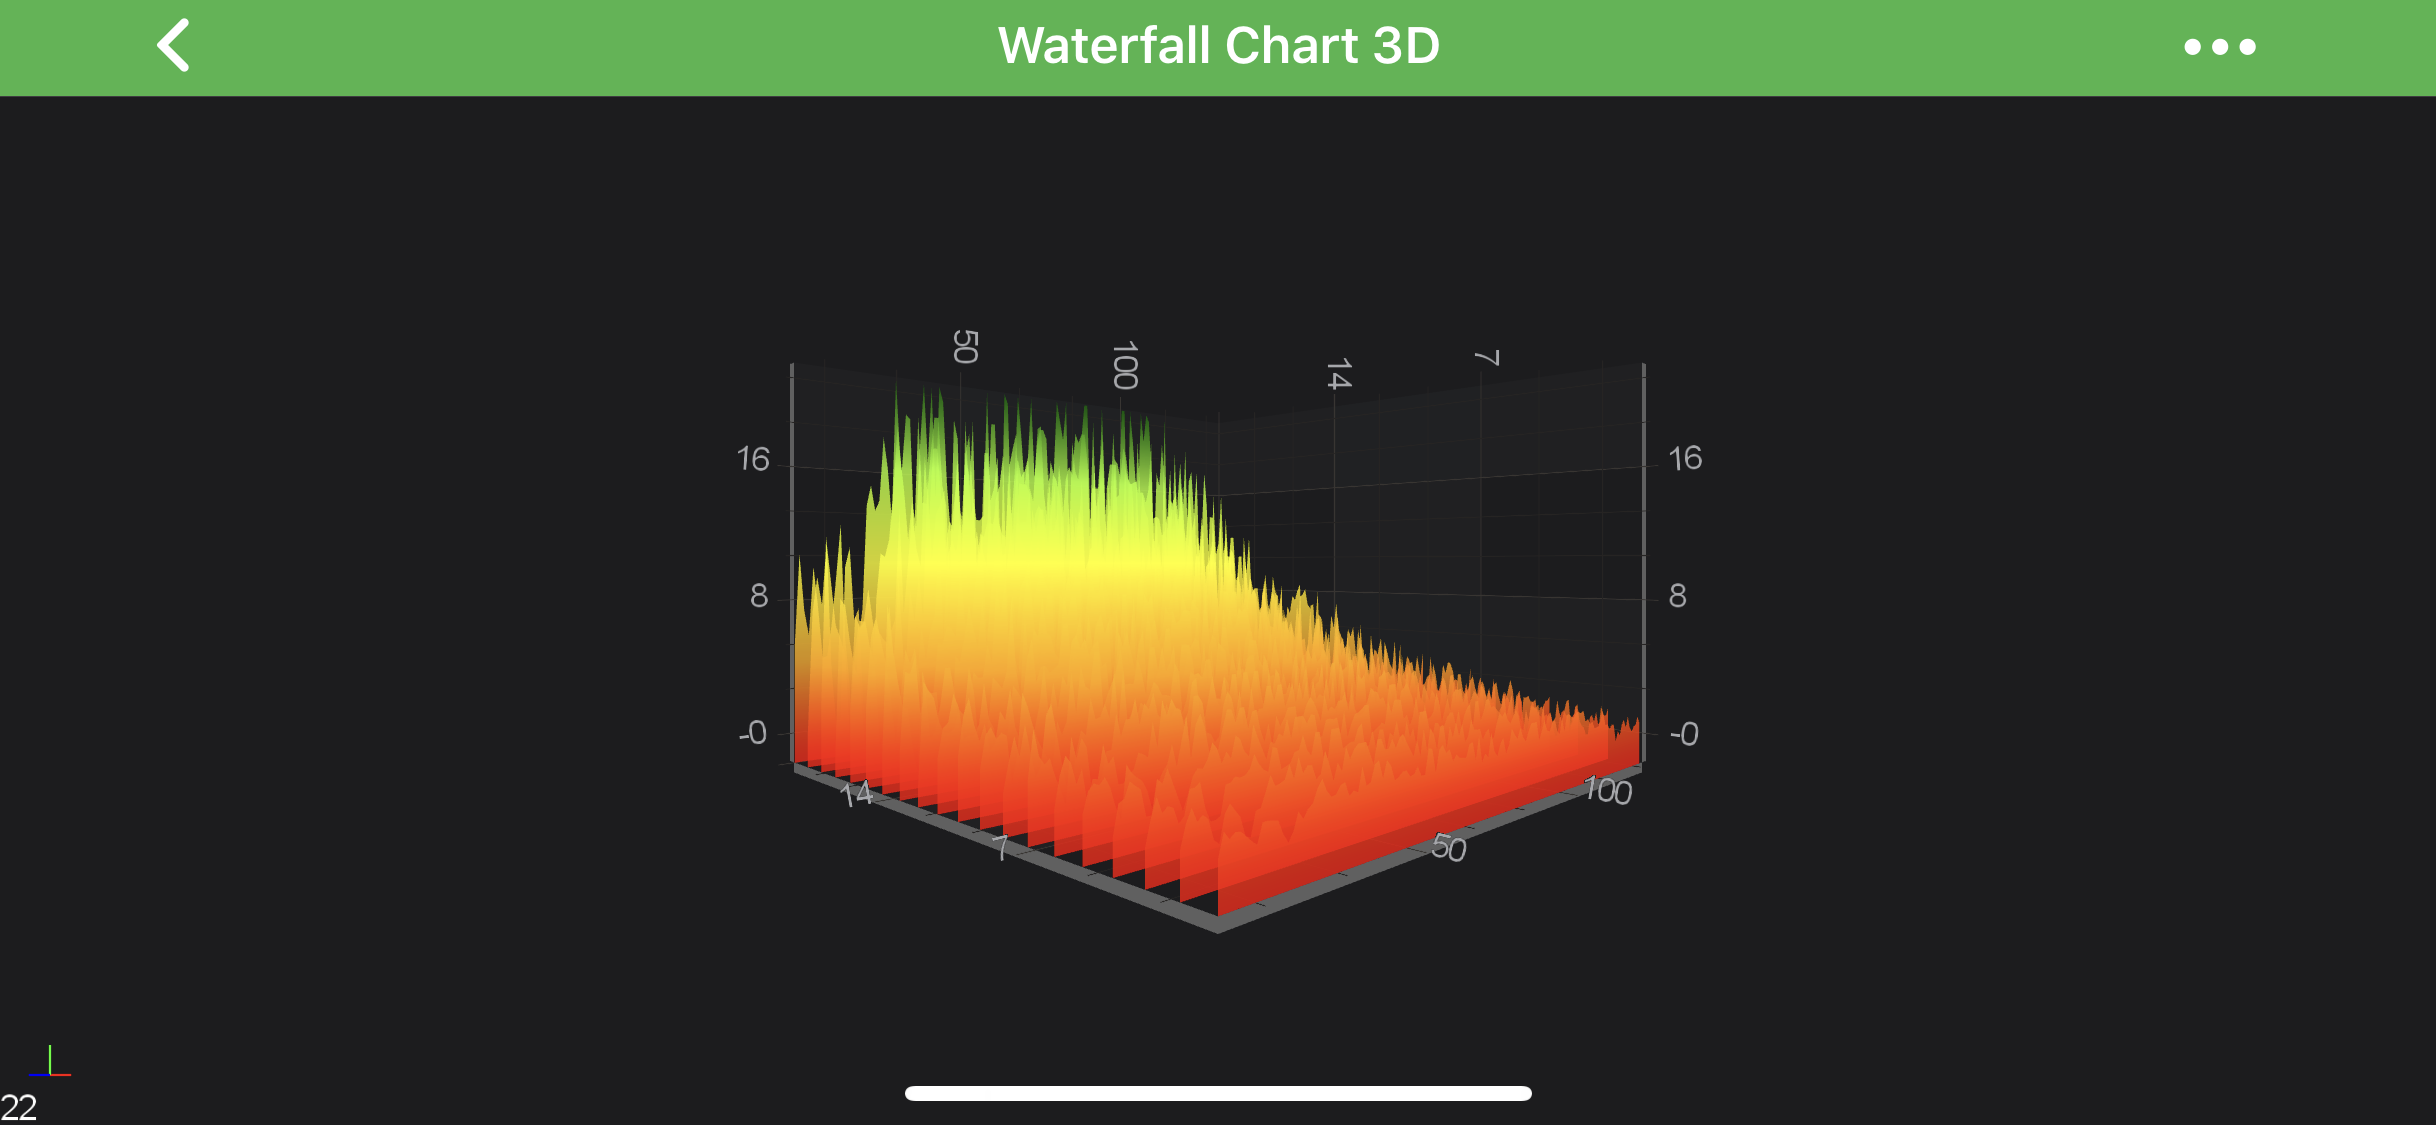
In order to create Waterfall Series - you will need to provide the WaterfallDataSeries3D<TX,TY,TZ> with N x M array of points, which is an array of slices.
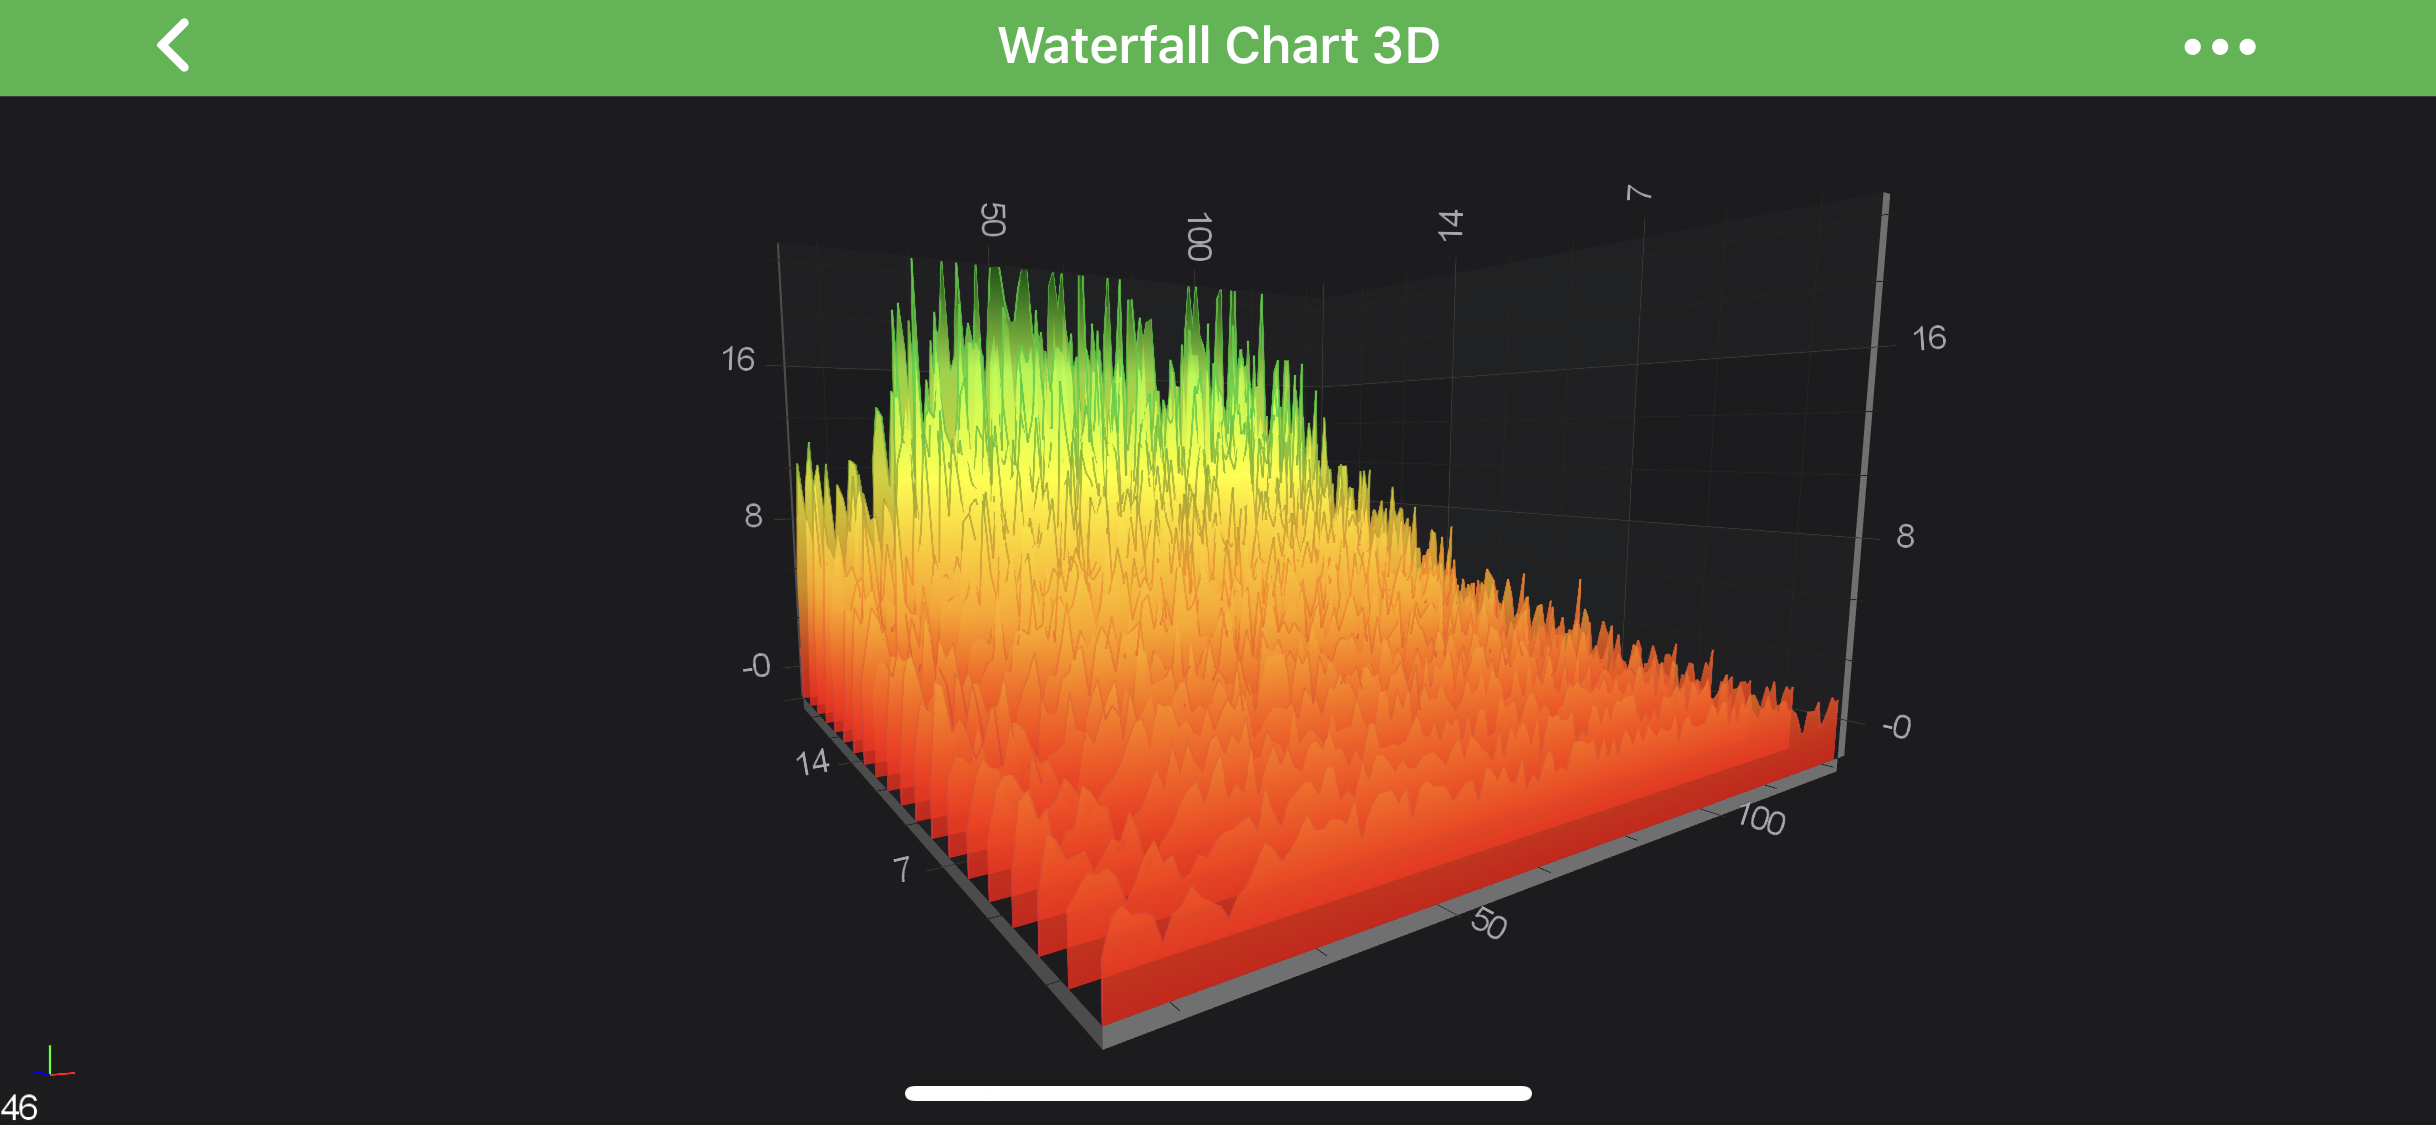
See the code below, which shows how to create the above chart:
final GradientColorPalette fillColorPalette = new GradientColorPalette(new int[]{0xFFFF0000, 0xFFFFA500, 0xFFFFFF00, 0xFFADFF2F, 0xFF006400}, new float[]{0.0f, 0.25f, 0.5f, 0.75f, 1.0f});
final GradientColorPalette strokeColorPalette = new GradientColorPalette(new int[]{0xFFDC143C, 0xFFFF8C00, 0xFF32CD32, 0xFF32CD32}, new float[]{0.0f, 0.33f, 0.67f, 1.0f});

final WaterfallDataSeries3D<Double, Double, Double> ds = new WaterfallDataSeries3D<>(Double.class, Double.class, Double.class, POINTS_PER_SLICE, SLICE_COUNT);
ds.setStartX(10.0);
ds.setStartZ(1.0);

fillDataSeries(ds);

final WaterfallRenderableSeries3D rSeries = new WaterfallRenderableSeries3D();
rSeries.setDataSeries(ds);
rSeries.setStroke(0xFF0000FF);
rSeries.setStrokeThickness(convertValueToDp(1.0f));
rSeries.setSliceThickness(0.0f);
rSeries.setYColorMapping(fillColorPalette);
rSeries.setYStrokeColorMapping(strokeColorPalette);
rSeries.setOpacity(0.8f);
Applying Palettes to the Waterfall
The Waterfall chart obeys Palette rules similar to that of the 3D SurfaceMesh Chart. To learn more about the types of palette available and how to declare them - please see the Applying Palettes section of the 3D SurfaceMesh Chart article.
Palettes which may be applied to the WaterfallRenderableSeries3D chart include:
- SolidColorBrushPalette - applies a solid color the waterfall slice or stroke.
- GradientColorPalette - maps a linear gradient to the slice or stroke, where heights map to successive colors.
The properties which allow colouring the Waterfall slices and outlines are available for the Z-Direction and Y-Direction.
Those are mutually exclusive, and you should choose one direction at a time.
Read on to see some examples of applying Palettes to WaterfallRenderableSeries3D.
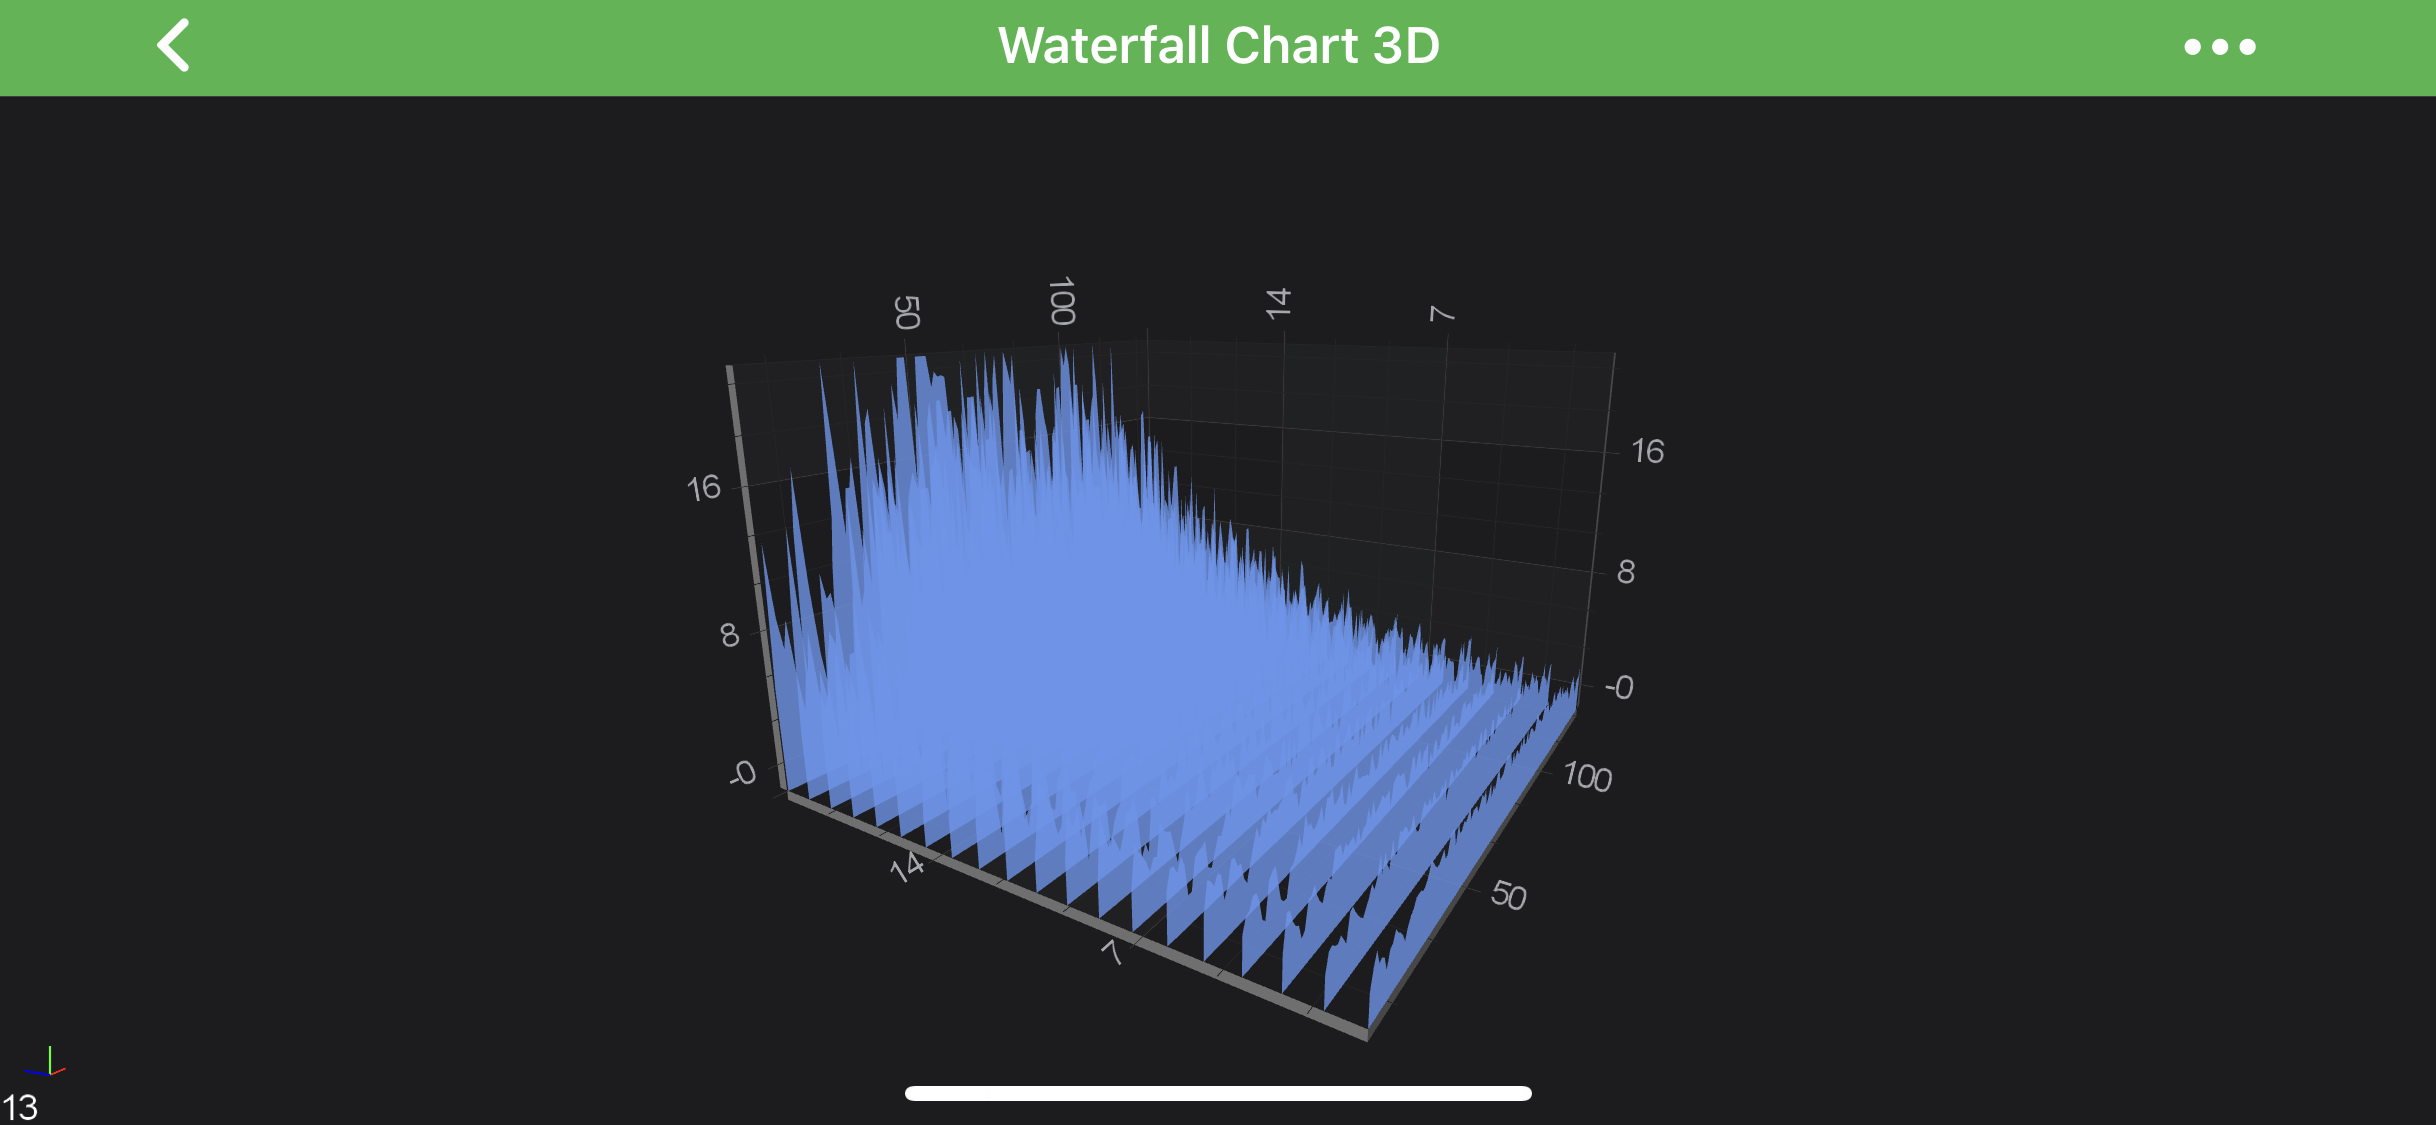
Applying Solid Palettes to Waterfall Slices
To apply Solid color to the Waterfall Slices, please use the following code:
rSeries.setYColorMapping(new SolidColorBrushPalette(0xFF6495ED));
rSeries.setYStrokeColorMapping(new SolidColorBrushPalette(0xFF6495ED));
| Solid Fill | Solid Outline |
|---|---|
 |
 |
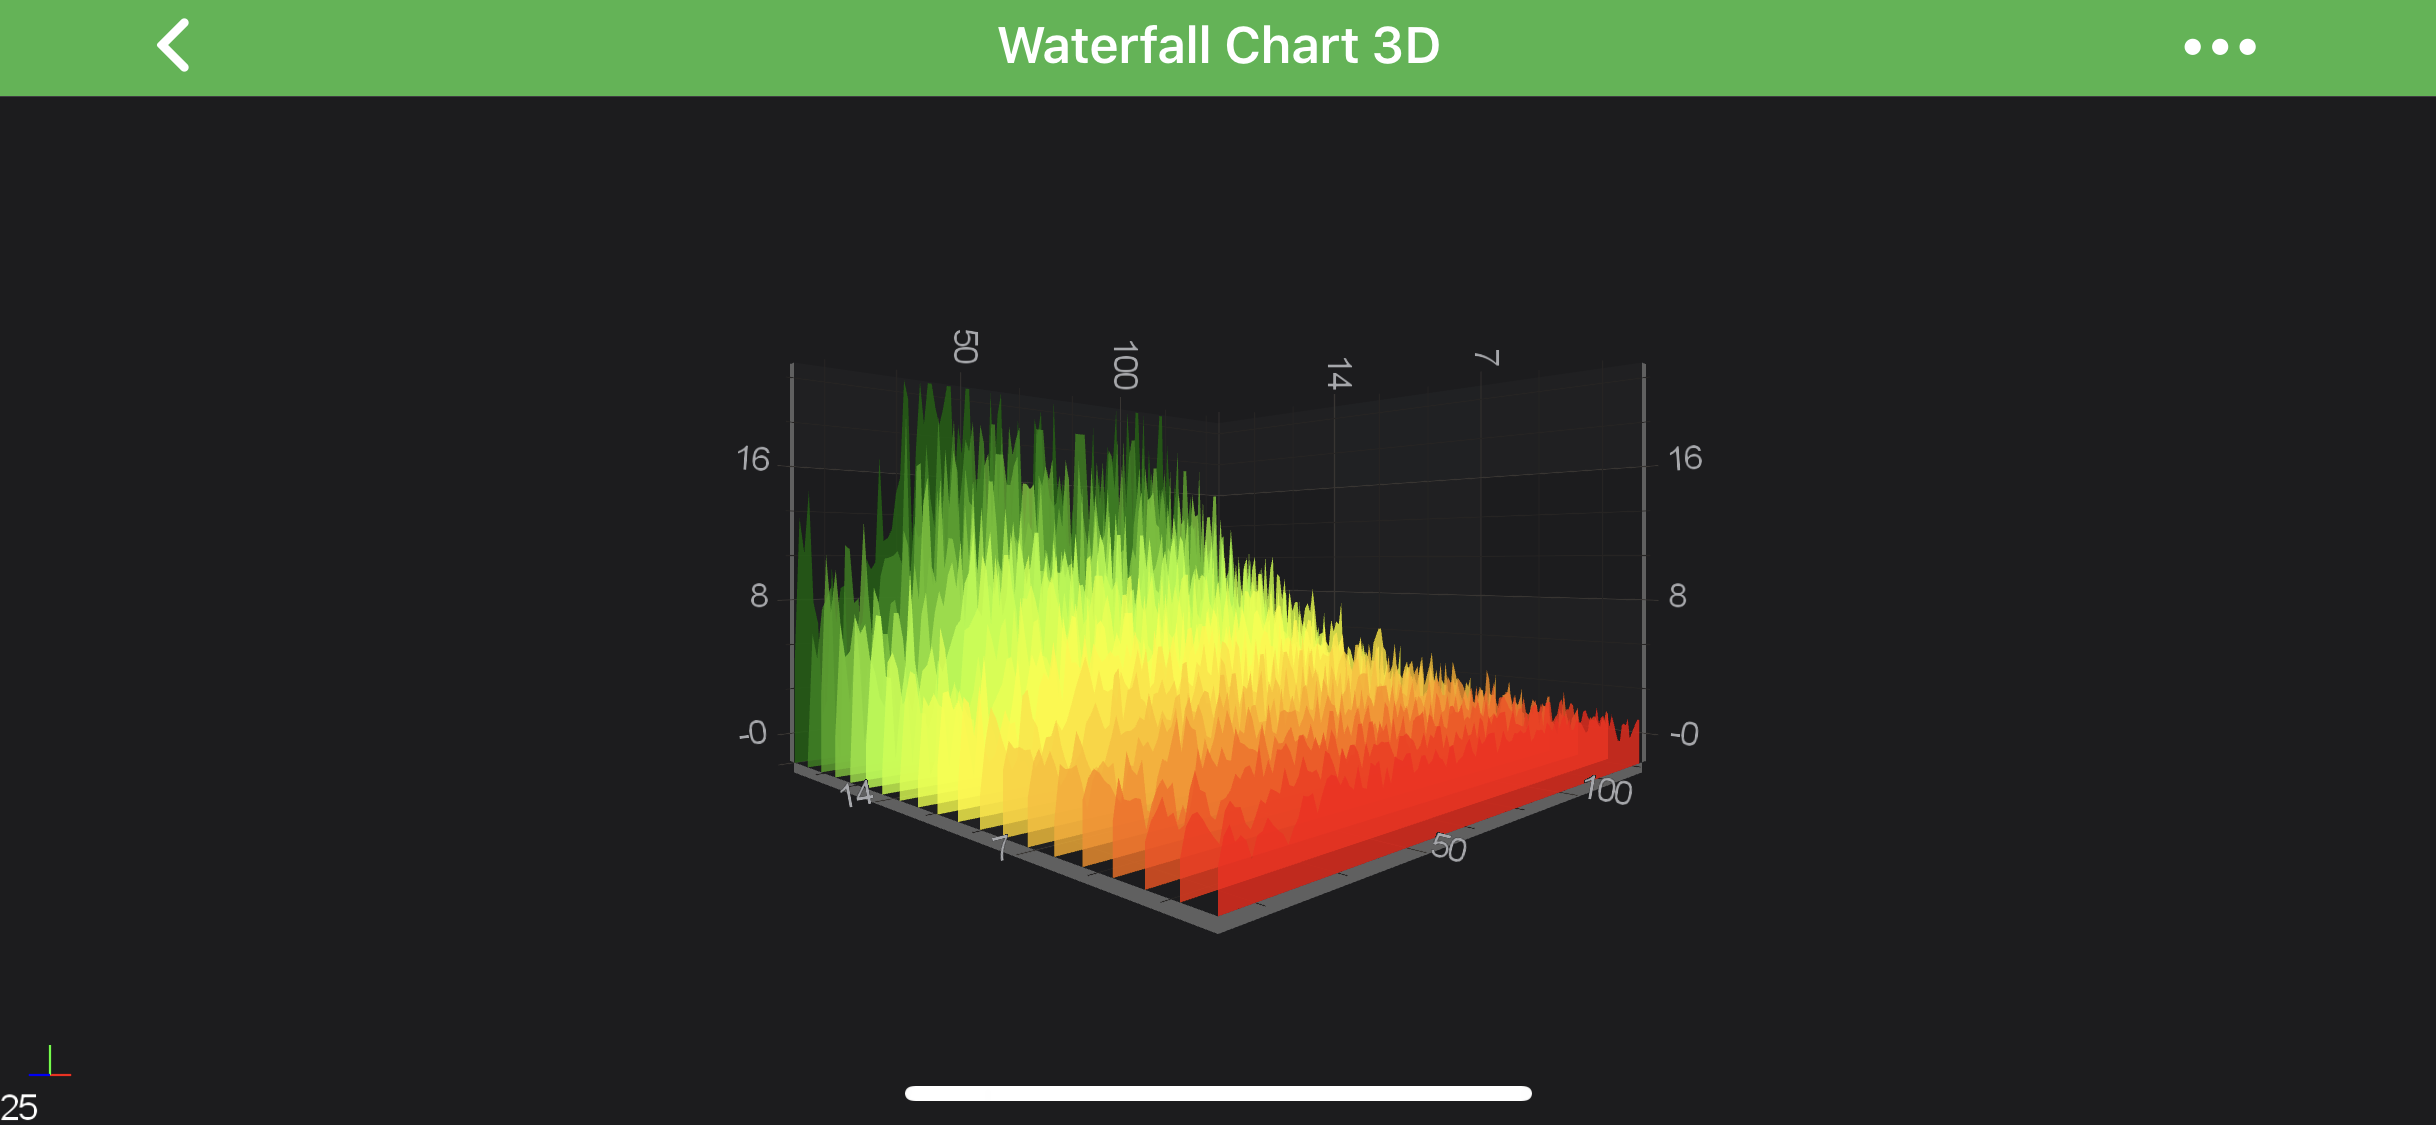
Applying Linear Gradient Palettes to Waterfall Slice Fill
To apply Linear Gradient to the Waterfall Slices, first prepare the GradientColorPalette for the upcoming steps:
final int[] colors = new int[]{0xFFFF0000, 0xFFFFA500, 0xFFFFFF00, 0xFFADFF2F, 0xFF006400};
final float[] stops = new float[]{0, .25f, .5f, .75f, 0};
final GradientColorPalette colorPalette = new GradientColorPalette(colors, stops);
From here, we can apply it to the Slice Fill, Outline or Both.
Applying a Color Palette onto Slice Fill in a Y or Z direction:
// Z-Direction
rSeries.setZColorMapping(colorPalette);
rSeries.setZStrokeColorMapping(new SolidColorBrushPalette(0x00FFFFFF));

// or Y-Direction
rSeries.setYColorMapping(colorPalette);
rSeries.setYStrokeColorMapping(new SolidColorBrushPalette(0x00FFFFFF));
| Z-Direction Fill | Y-Direction Fill |
|---|---|
 |
 |
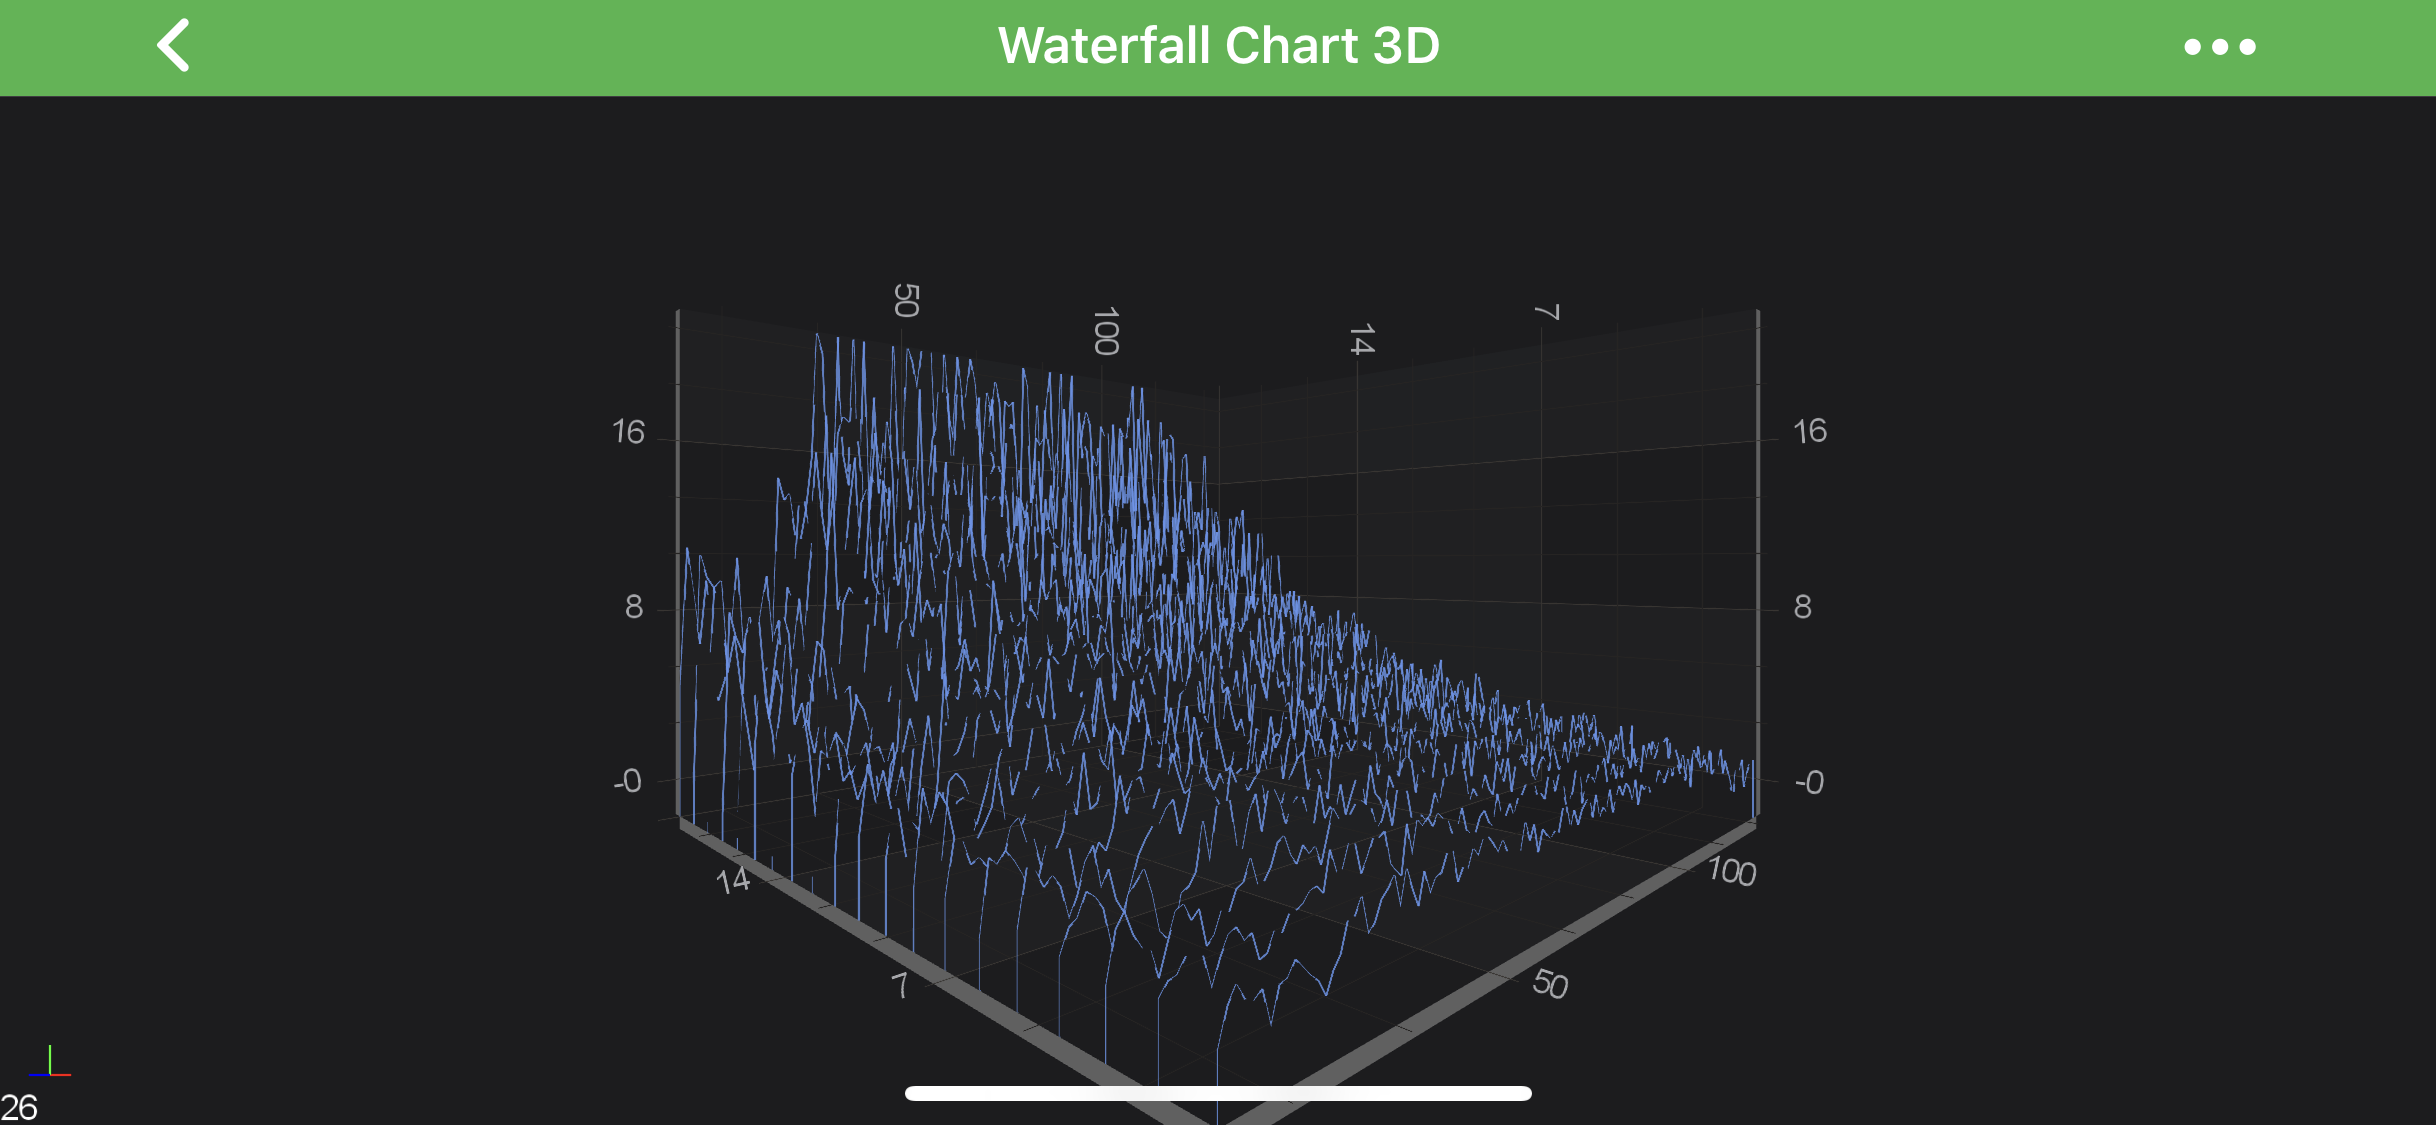
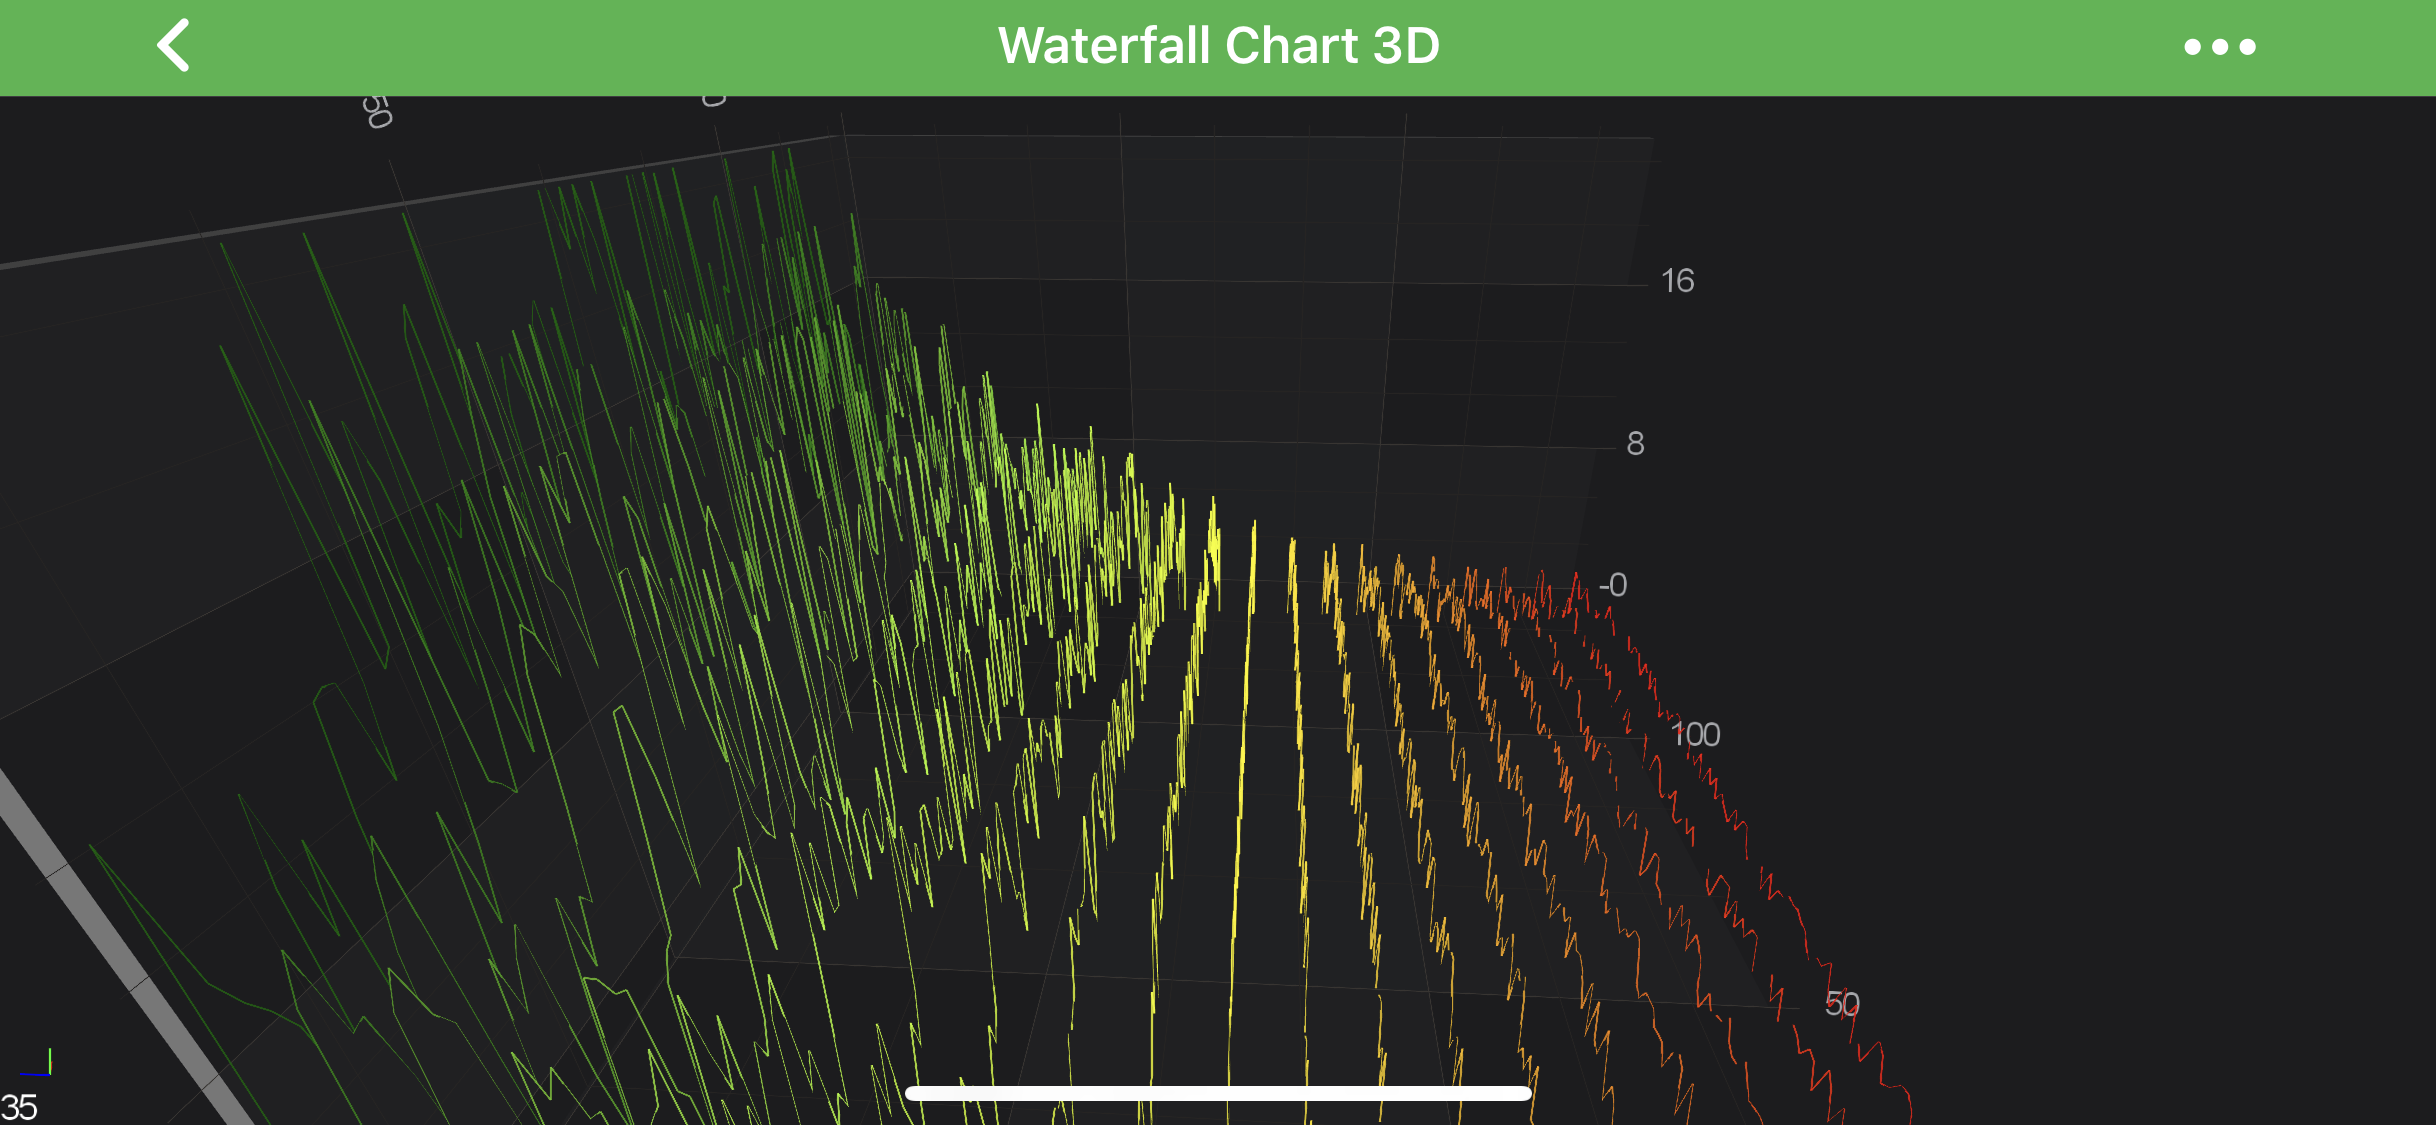
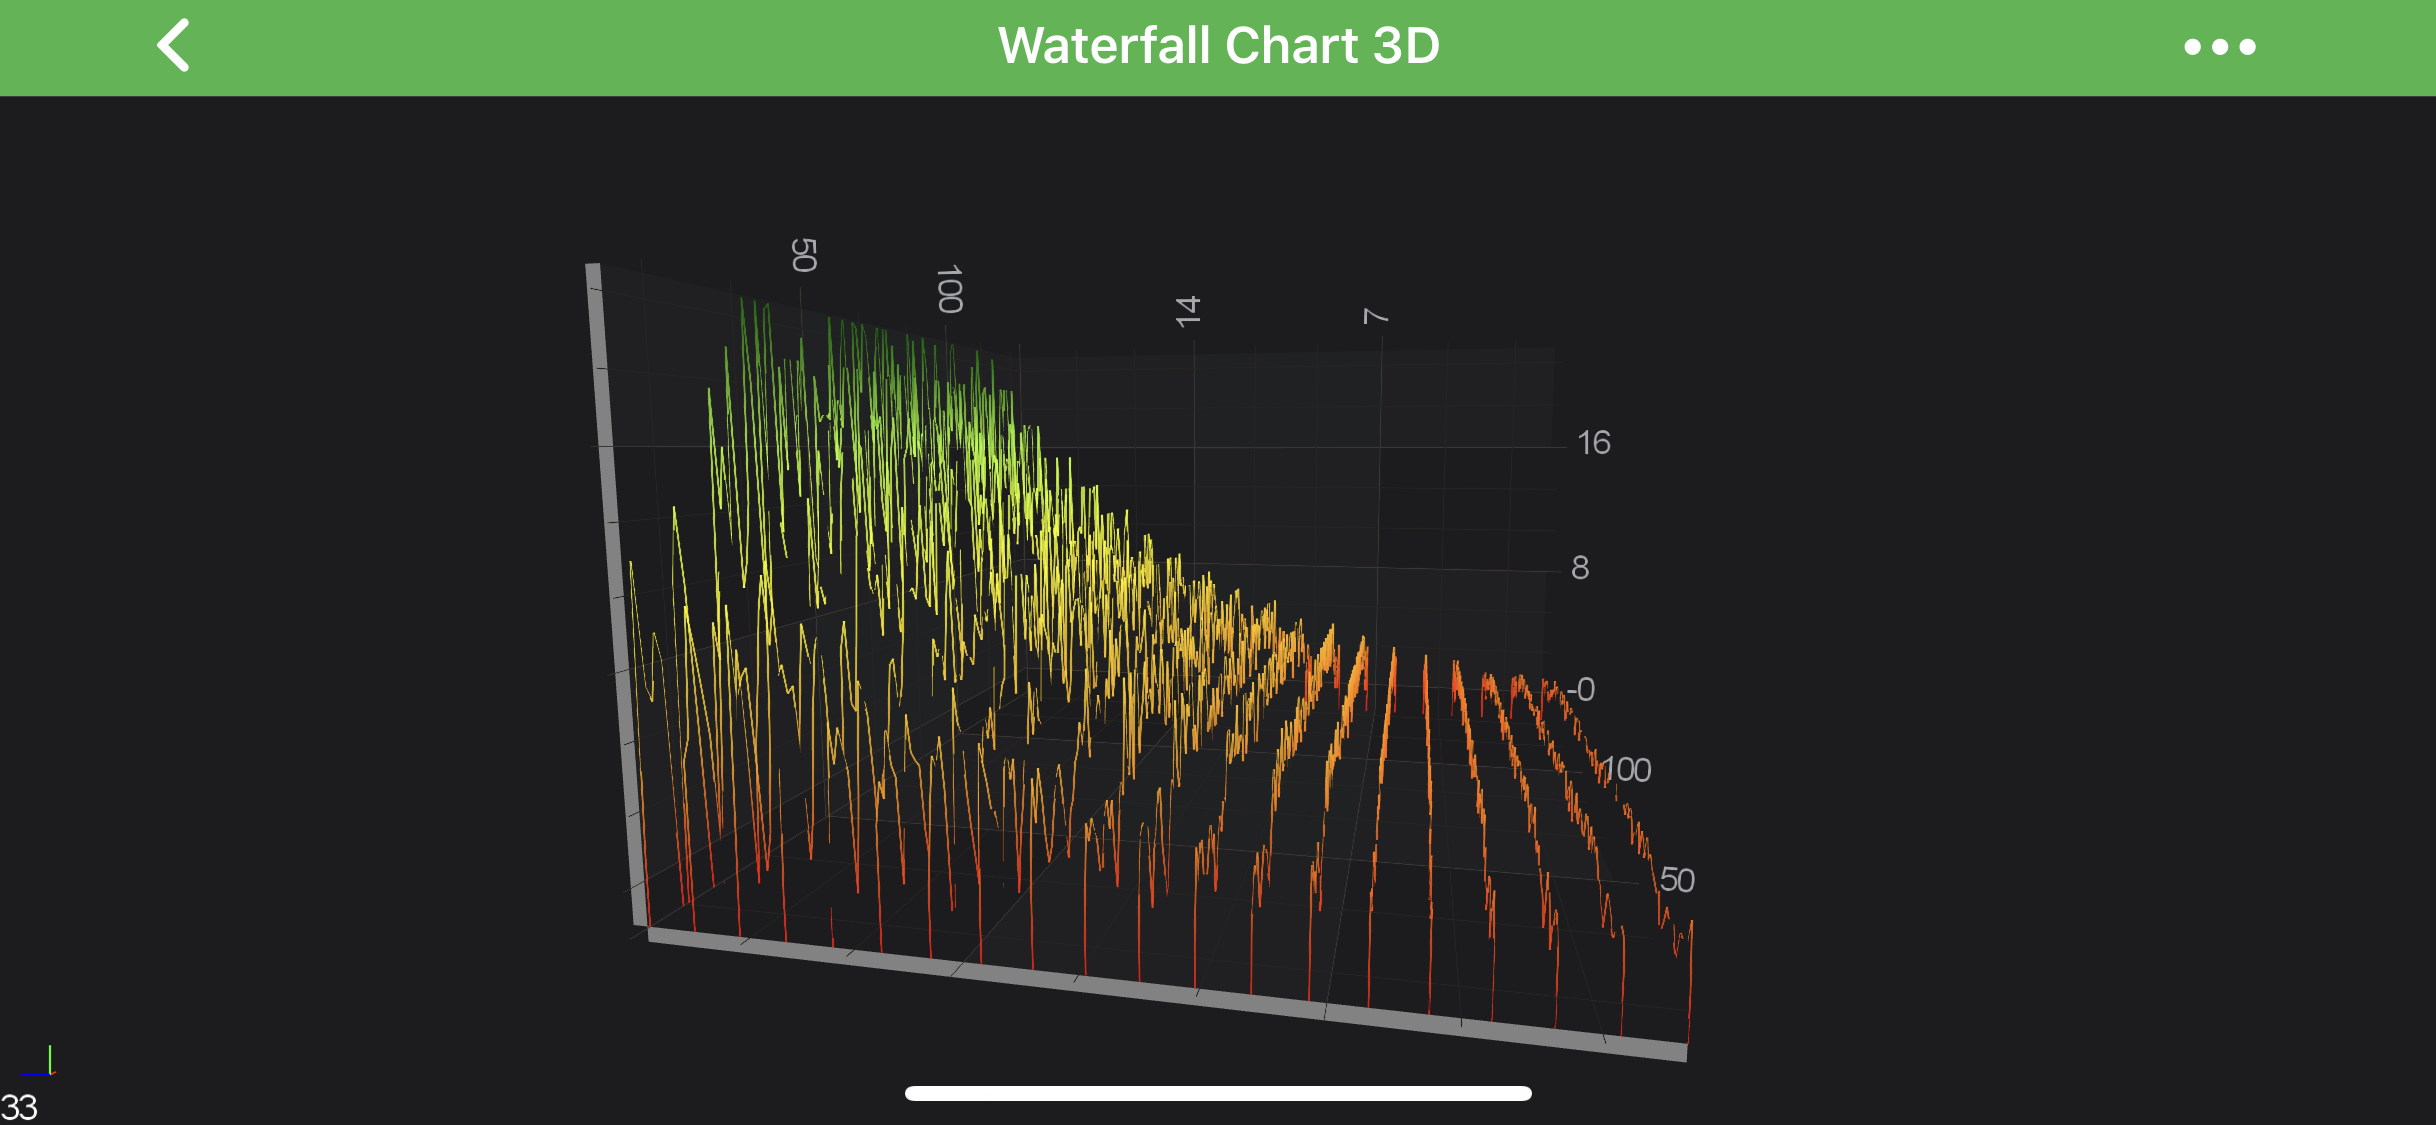
Applying a Color Palette onto Slice Stroke in a Y or Z direction:
// Z-Direction
rSeries.setZColorMapping(new SolidColorBrushPalette(0x00FFFFFF));
rSeries.setZStrokeColorMapping(colorPalette);

// or Y-Direction
rSeries.setYColorMapping(new SolidColorBrushPalette(0x00FFFFFF));
rSeries.setYStrokeColorMapping(colorPalette);
| Z-Direction Stroke | Y-Direction Stroke |
|---|---|
 |
 |
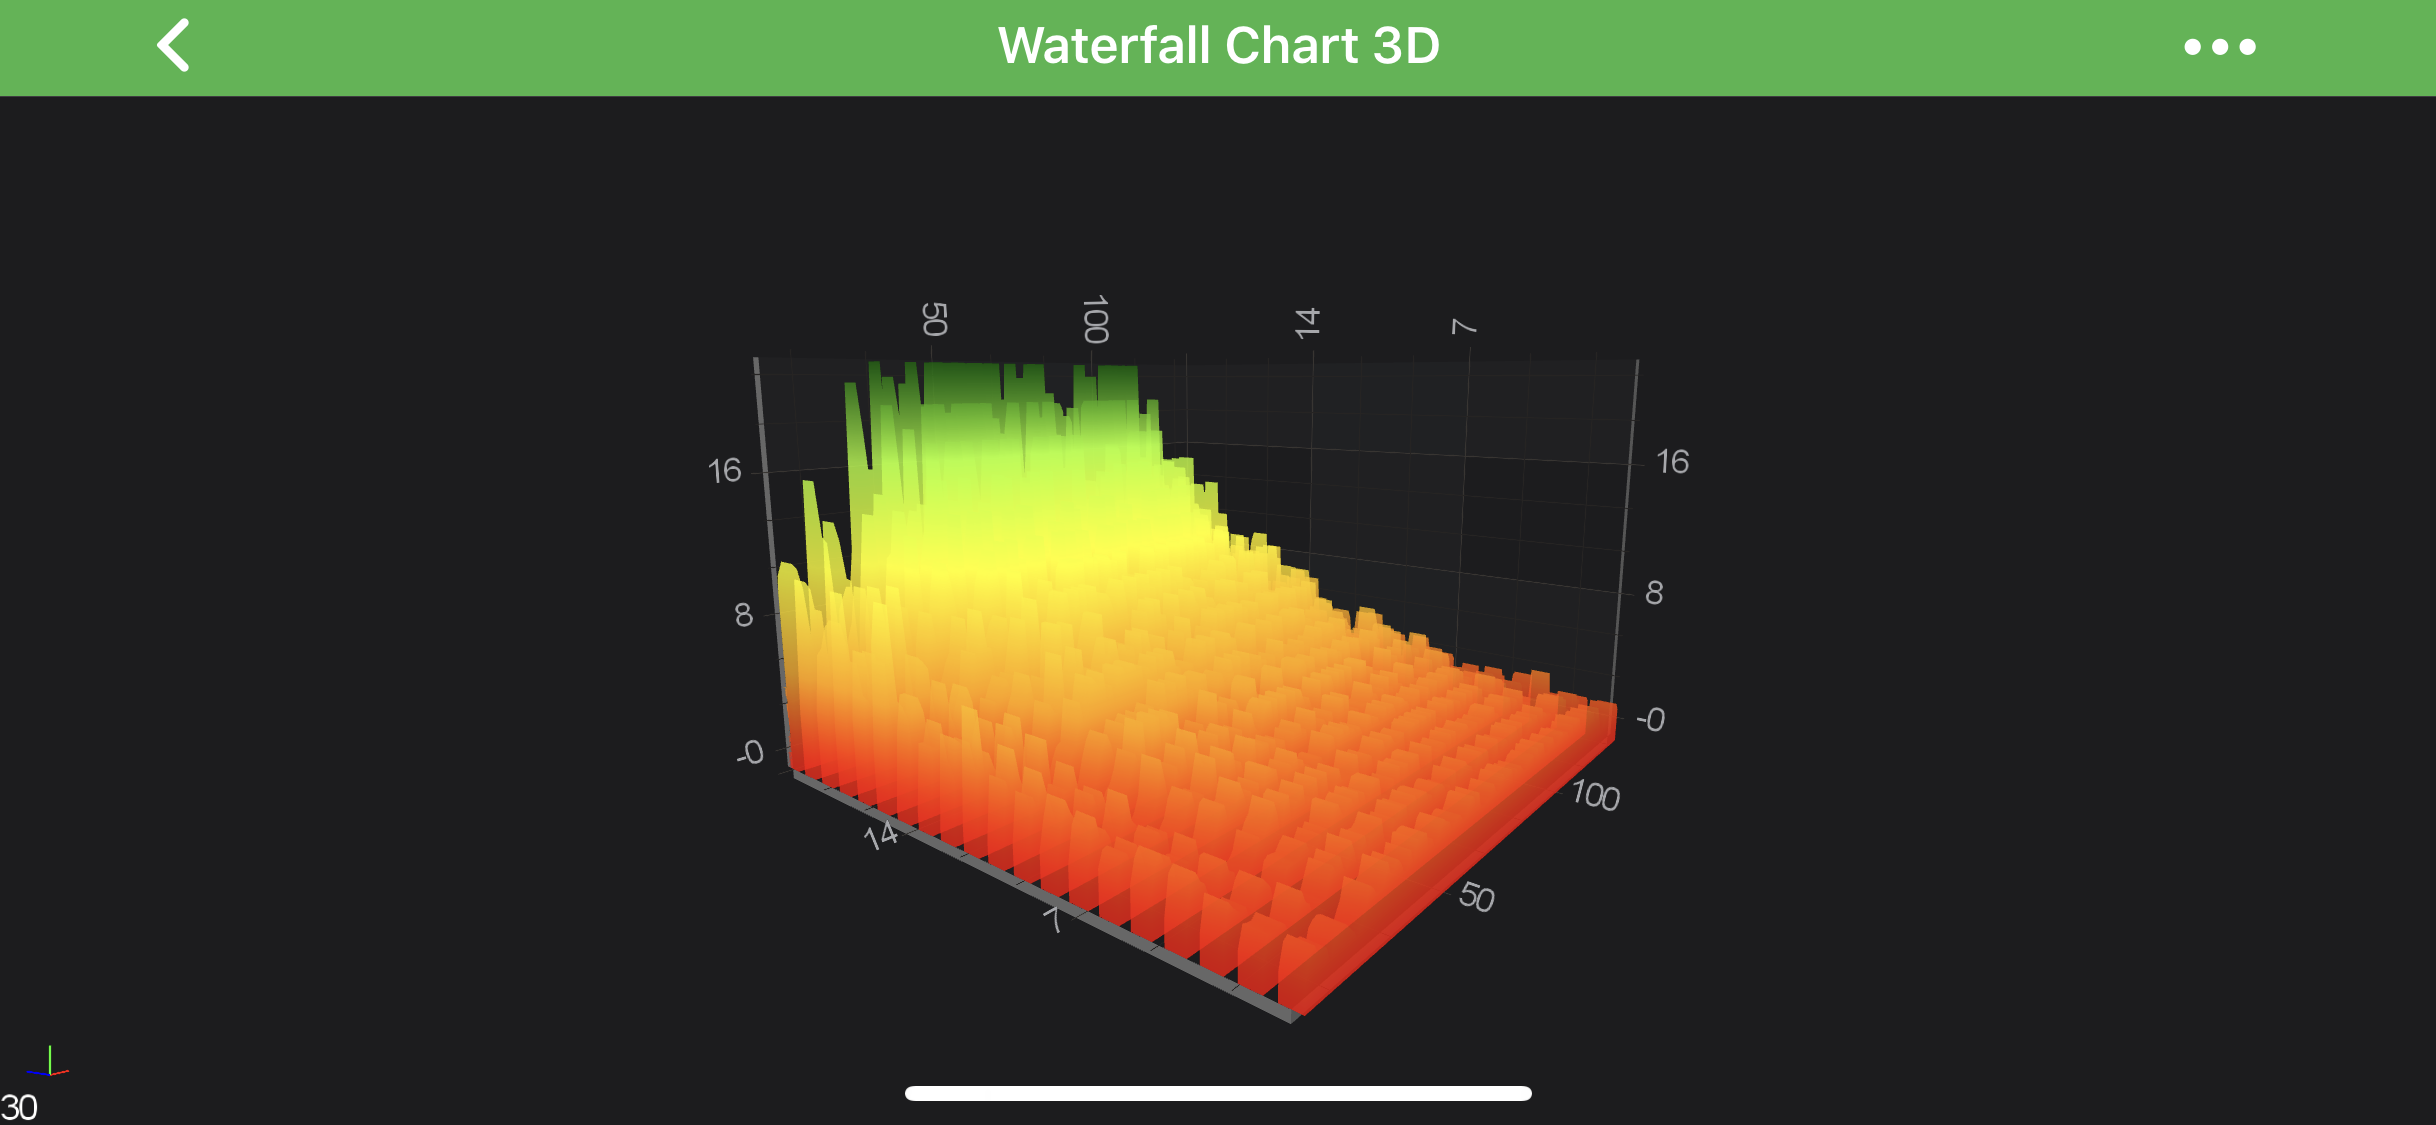
Volumetric Waterfall 3D
A Waterfall Chart can be made volumetric by setting the property sliceThickness (default value = 0), e.g.:
final WaterfallRenderableSeries3D rSeries = new WaterfallRenderableSeries3D();
rSeries.setSliceThickness(10.0f);
PointMarkers on Waterfall 3D
A Waterfall Chart Slice data-points can be marked with a Point Markers. That's achieved by providing the Point Marker 3D for the WaterfallRenderableSeries3D. See the code snipped below:
final SpherePointMarker3D pointMarker = new SpherePointMarker3D();
pointMarker.setFill(0xFFFFA500);
pointMarker.setSize(convertValueToDp(10.0f));

final WaterfallRenderableSeries3D rSeries = new WaterfallRenderableSeries3D();
rSeries.setPointMarker(pointMarker);
Note
For more information - please refer to the PointMarker API article.
Real-time Waterfall 3D Example
In SciChart, it's possible to create real-time Waterfall 3D Charts which is shown below:
Note
Examples of the Real-Time Waterfall 3D Series can be found in the SciChart Android Examples Suite as well as on GitHub: