
Axis Ticks, Labels and Grid Lines
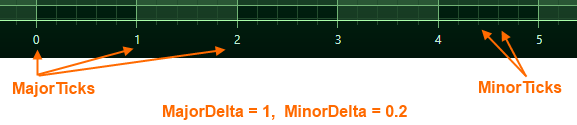
In SciChart.js, the Ticks are small marks around the chart on an axis. There are Minor and Major Ticks, where Minor Ticks are placed in between Major ones. Axis Labels appears for every Major Tick, and Grid Lines correspond to Ticks on an axis.
In SciChart, axes are responsible not only for drawing Ticks and Labels, but also for the chart grid. So if you want to change the spacing of gridlines, labels or tick marks, you need to use the APIs to change Axis Tick spacing.
Automatic Gridline, Label or Tick Spacing
In SciChart.js, the difference between two Major Gridlines is defined by axisCore.MajorDelta. The difference between two minor gridlines is defined by axisCore.MinorDelta.
By default, MajorDelta and MinorDelta values are calculated automatically when axis.autoTicks = true. Major/Minor deltas are calculated dynamically according to the VisibleRange and size of an axis in pixels. This means as you zoom and pan, these properties are updated and you get a dynamic gridline spacing effect.
Configuring Automatic Tick Spacing
If you want to congigure Automatic Tick Spacing, do the following:
- set axis.autoTicks = true
- set axis.maxAutoTicks = a numeric value (e.g. 10)
- set axis.minorsPerMajor property = a numeric value (e.g. 5)
With a configuration like the above, SciChart.js will calculate tick spacing on the axis with up to 10 major gridlines / labels and 5 minor gridlines per major.
This results in the following output:
<div id="scichart-root" ></div>
body { margin: 0; }
#scichart-root { width: 100%; height: 100vh; }
async function axisAutoTicks(divElementId) {
// #region ExampleA
// Demonstrates how to configure axis autoticks in SciChart.js
const {
  SciChartSurface,
  NumericAxis,
  SciChartJsNavyTheme,
} = SciChart;

// or, for npm, import { SciChartSurface, ... } from "scichart"

const { wasmContext, sciChartSurface } = await SciChartSurface.create(divElementId, {
  theme: new SciChartJsNavyTheme()
});

// Adjust major/minor gridline style to make it clearer for the demo
const styleOptions = {
  majorGridLineStyle: { color: "#50C7E077"},
  minorGridLineStyle: { color: "#50C7E033"},
};

const xAxis = new NumericAxis(wasmContext, {
  axisTitle: "maxAutoTicks 10, minorsPerMajor 2",
  // Default true, automatically calculate axis.MajorDelta, axis.MinorDelta
  autoTicks: true,
  // This is a hint which defines the max number of major gridlines/labels visible at any one time.
  // The actual number of gridlines may be lower than this depending on zoom level
  maxAutoTicks: 10,
  // For every major gridline, this defines how many minor gridlines there are. Default is 5.
  minorsPerMajor: 2,
  ...styleOptions
});

// Properties may also be set after instantiation, e.g.
xAxis.autoTicks = true;
xAxis.maxAutoTicks = 10;
xAxis.minorsPerMajor = 2;

const yAxis = new NumericAxis(wasmContext, {
  axisTitle: "maxAutoTicks 5, minorsPerMajor 4",
  autoTicks: true,
  maxAutoTicks: 5,
  minorsPerMajor: 4,
  ...styleOptions
});

sciChartSurface.xAxes.add(xAxis);
sciChartSurface.yAxes.add(yAxis);
// #endregion
};
axisAutoTicks("scichart-root");
async function builderExample(divElementId) {
// #region ExampleB
// Demonstrates how to configure a axis autoticks in SciChart.js using the Builder API
const {
  chartBuilder,
  EThemeProviderType,
  EAxisType,
} = SciChart;

// or, for npm, import { chartBuilder, ... } from "scichart"

const { wasmContext, sciChartSurface } = await chartBuilder.build2DChart(divElementId, {
  surface: { theme: { type: EThemeProviderType.Dark } },
  xAxes: {
    type: EAxisType.NumericAxis,
    options: {
      axisTitle: "maxAutoTicks 10, minorsPerMajor 2",
      autoTicks: true,
      maxAutoTicks: 10,
      minorsPerMajor: 2,
    }
  },
  yAxes: {
    type: EAxisType.NumericAxis,
    options: {
      axisTitle: "maxAutoTicks 5, minorsPerMajor 4",
      autoTicks: true,
      maxAutoTicks: 5,
      minorsPerMajor: 4
    }
  },
});
// #endregion
};
// Uncomment this to use the builder example
//builderExample("scichart-root");
Specifying Major & Minor Deltas
There are two methods to control gridline & label spacing in SciChart.js. The first is the simplest, by specifying axis major & minor delta.
- set axis.autoTicks = false
- set axis.majorDelta = a numeric value (e.g. 2)
- set axis.minorDelta = a numeric value (e.g. 0.4)
With a configuration like the above, SciChart.js will calculate tick spacing on the axis exactly an interval of 2 between major gridlines / labels and 0.4 between minor gridlines.
This results in the following output:
<div id="scichart-root" ></div>
body { margin: 0; }
#scichart-root { width: 100%; height: 100vh; }
async function axisAutoTicksFalse(divElementId) {
// #region ExampleA
// Demonstrates how to configure axis autoticks in SciChart.js
const {
  SciChartSurface,
  NumericAxis,
  SciChartJsNavyTheme,
} = SciChart;

// or, for npm, import { SciChartSurface, ... } from "scichart"

const { wasmContext, sciChartSurface } = await SciChartSurface.create(divElementId, {
  theme: new SciChartJsNavyTheme()
});

// Adjust major/minor gridline style to make it clearer for the demo
const styleOptions = {
  majorGridLineStyle: { color: "#50C7E077"},
  minorGridLineStyle: { color: "#50C7E033"},
};

const xAxis = new NumericAxis(wasmContext, {
  axisTitle: "majorDelta 2, minorDelta 1",
  // When autoTicks is false, you must specify majorDelta and minorDelta
  autoTicks: false,
  // Have a major gridline every 2 units on the axis
  majorDelta: 2,
  // Have a minor gridline every 1 unit on the axis
  minorDelta: 1,
  ...styleOptions
});

// Properties may also be set after instantiation, e.g.
xAxis.autoTicks = false;
xAxis.majorDelta = 2;
xAxis.minorDelta = 1

const yAxis = new NumericAxis(wasmContext, {
  axisTitle: "majorDelta 2, minorDelta 1",
  autoTicks: false,
  majorDelta: 1,
  minorDelta: 0.2,
  ...styleOptions
});

sciChartSurface.xAxes.add(xAxis);
sciChartSurface.yAxes.add(yAxis);
// #endregion
};
axisAutoTicksFalse("scichart-root");
async function builderExample(divElementId) {
// #region ExampleB
// Demonstrates how to configure axis autoticks in SciChart.js using the Builder API
const {
  chartBuilder,
  EThemeProviderType,
  EAxisType,
} = SciChart;

// or, for npm, import { chartBuilder, ... } from "scichart"

const { wasmContext, sciChartSurface } = await chartBuilder.build2DChart(divElementId, {
  surface: { theme: { type: EThemeProviderType.Dark } },
  xAxes: {
    type: EAxisType.NumericAxis,
    options: {
      axisTitle: "majorDelta 2, minorDelta 1",
      autoTicks: false,
      majorDelta: 2,
      minorDelta: 1,
    }
  },
  yAxes: {
    type: EAxisType.NumericAxis,
    options: {
      axisTitle: "majorDelta 2, minorDelta 1",
      autoTicks: false,
      majorDelta: 1,
      minorDelta: 0.2,
    }
  },
});
// #endregion
};
// Uncomment this to use the builder example
//builderExample("scichart-root");
Dynamic Control of Gridline, Label & Tick Spacing on Zoom
The above method of setting Major/Minor Delta could be dynamic if you combine with Listening to Axis Range Changes.
However, if you want to have finer grained control over axis gridline, label or minor gridline spacing, then read The Tick Provider API Documentation.