
SciChart.js 3D shares the same AxisCore as SciChart.js 2D. Many features such as Text Formatting, Autorange (zooming to fit) and Styling are shared. For your convenience, some of the documentation has been duplicated here, with some referring to other sections of the user manual.
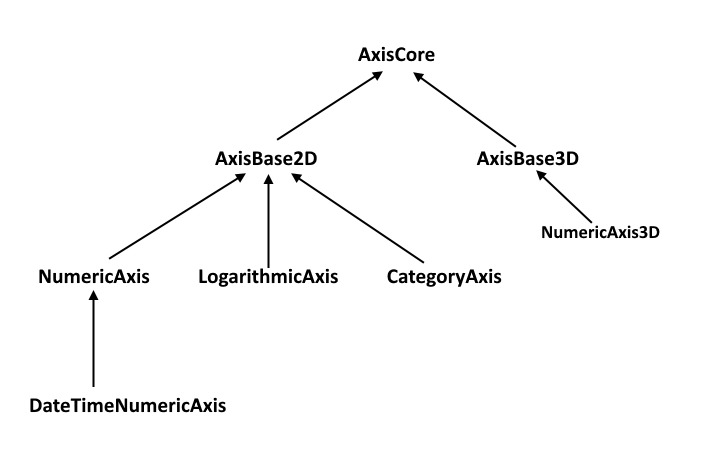
The Axis Types in SciChart all inherit from AxisCore and 3D axis inherit AxisBase3D. Below you can find an inheritance diagram. In the next section we're going to go over the main properties, types and what you can do with SciChart.js 3D Axis.
The AxisCore Type
AxisCore properties and methods can be seen at the TypeDoc documentation. We've also included a table of important properties below. Click on each link to jump to the TypeDoc documentation where you can see a description and type information.
- allow
Fast Math - animated
Visible Range - auto
Range - auto
Ticks - axis
Bands Fill - axis
Title - axis
Title Style - cursor
Text Formatting - delta
Calculator - dpi
Adjusted Axis Title Style - draw
Labels - draw
Major Bands - draw
Major Grid Lines - draw
Major Tick Lines - draw
Minor Grid Lines - draw
Minor Tick Lines - flipped
Coordinates - grow
By - id
- is
Category Axis - is
Visible - isXAxis
- label
Provider - major
Delta - major
Grid Line Style - major
Tick Line Style - max
Auto Ticks - minor
Delta - minor
Grid Line Style - minor
Tick Line Style - minors
Per Major - text
Formatting - tick
Coordinates Provider - tick
Provider - visible
Range
Some important properties to note: autoRange, textFormatting, major/minorGridLineStyle and properties like drawLabels, drawMajorGridlines etc... We're going to explain more on how to use these later.
The AxisBase3D Type
AxisBase3D inherits AxisCore and has some additional properties specific to 3D charts. These include:
- axis
Plane Background Fill - background
Color - label
Depth Test Enabled - negative
Side Clipping - plane
Border Color - plane
Border Thickness - positive
Side Clipping - tick
Label Alignment - tick
Labels Offset - title
Offset
Basic Examples of how to declare an Axis
Axis 3D APIs
Below are the key things you can do with the axis in SciChart.js 3D and where to find more information.
Axis 3D Text (Label) Formatting
All Axis in SciChart use the labelProviders to format text for the axis labels and cursor (tooltip) labels.
Background information can be found found at the Axis LabelProvider API Overview.
Specific example code for formatting 3D Axis text labels can be found in the article Axis3D Text (Label) Formatting).
Axis 3D AutoRanging & Setting VisibleRange
AxisBase3D derived Types also have auto-ranging behaviour as per the 2D axis types. The axis.autoRange property defines how the axis will autorange when data is changed.
The axis.visibleRange property allows you to set or get the min, max on the axis.
axis.growBy allows you to set padding on the visibleRange.
axis.visibleRangeChanged is an event or callback which fires when the range is updated.
For more info see:
NOTE: In a 3D Axis, AutoRanging means ‘given a fixed size of Axis in 3D world coordinates, change the VisibleRange Max/Min to fit the data’.
Dynamically positioning the camera to view all of the 3D Chart would require updating the camera position, target. See the article on Camera 3D for more information.
Axis 3D Tick / Label Frequency
In SciChart.js, the ticks are small marks around the chart on an axis. They Also define the spacing of Gridlines, Axis Labels and Axis Bands.
AxisBase3D tick intervals can be changed using the same APIs as SciChart 2D. For further information see Axis 3D Gridline and Label Spacing.
Axis 3D Element Styling
For styling gridlines, labels and titles, the rules in SciChart.js 3D are the same as 2D charts.
There are some addditional elements on the 3D chart which can be styled, such as the axis walls. For more info see the article on Styling Gridlines, Labels and Elements.