
As well as several filters out of the box, such as Moving Average, Linear Trendline, Scale & Offset and Ratio filter, you can also create custom filters or data transforms in SciChart.js
There are two levels of filter customization, simple and advanced:
- If you just need to apply a transformation or filter function to each data point, use a simple Custom Filter by creating an instance of one of the CustomFilter types, and set your filter function.
- If you want to totally reshape your data, or perform transformations that need access to the entire dataSeries, create an Advanced Custom Filter by extending one of the FilterBase classes.
Simple Custom Filters
There are Custom Filter classes for each of the main series types:
- XyCustomFilter
- XyyCustomFilter
- XyzCustomFilter
- OhlcCustomFilter
They all have a filterFunction of type (index: number, y: number) => number which will be applied to each data value in the series. The multiValue series types have additional properties for each of the data values.
E.g. for an XyyCustomFilter you can potentially apply different functions to y and y1 by setting filterfunction and y1filterFunction.
For OhlcCustomFilter, the closefilterFunction will apply to any field which does not have an explicit function set.
Worked Example: Excluding data from a chart depending on Y-value
The following worked example demonstrates how to create a Simple custom filter. We use a filterFunction and exclude any values that are inside the range y=0.33 to 0.66 by returning NaN.
This results in the following output:
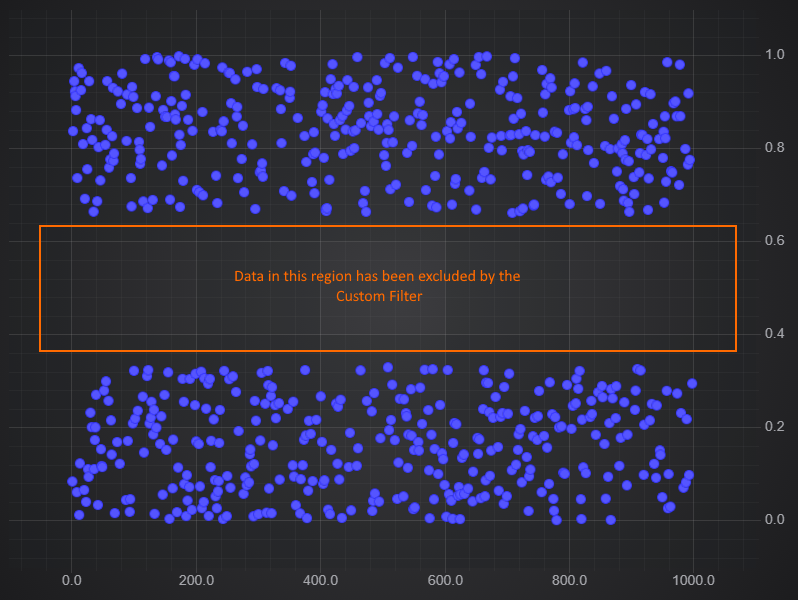
When creating a filtering function (as opposed to a transformation function) return NaN for points from the original dataset you want to exclude.
Reusable Simple Custom Filters
If you want to be able to reuse your simple filter but with some parameters, you can extend the relevant CustomFilter class and embed your function in it.
For example:
Advanced Custom Filters
To create an Advanced Custom Filter we simply extend the FilterBase of the type of series we want ie (XyFilterBase, XyyFilterBase, XyzFilterBase, OhlcFilterBase). We must then implement the filterAll method to perform filtering. Optionally, we can implement one or more of the following to gain performance if our transformation allows for partial recalculation.
- filterOnAppend(count: number): void
- filterOnUpdate(index: number): void
- filterOnInsert(startIndex: number, count: number): void
- filterOnRemove(startIndex: number, count: number): void
- onClear(): void
The base class handles the field mapping in the getOriginalYValues method (and getOriginalY1Values for Xyy, and similar for the other types).
The constructor should take the originalSeries and an options class, and call super with these. It should also call filterAll if data is available, as this is not done by the base class.
For example:
Worked Example - Advanced Custom Filters
You can find an example of an Advanced Custom Filter in the SciChart.js Examples Suite.
Please see the Realtime Aggregation using Advanced Custom Filter Example for more details.