Candle Counter
CandleCounter shows the price pane's candle counts as "visible / loaded / ~total":
- visible: the candles on screen;
- loaded: the candles the chart has loaded, including those off screen;
- ~total: an estimate of every candle since the symbol was listed on the exchange.
A count shows as "?" while it is still unknown. The counter updates as candles load and the user pans or zooms, at most once a frame. It writes its own text, so in React the page around it doesn't re-render as the chart moves.
It is made for the info area at the start of a pane control bar: the strip of buttons that appears at the top right of each chart pane when you hover over it. That is part of the chart, not a toolbar of your own. It works in plain TypeScript and in React; only how you reach the info area differs. See Showing It in the Pane Control Bar.
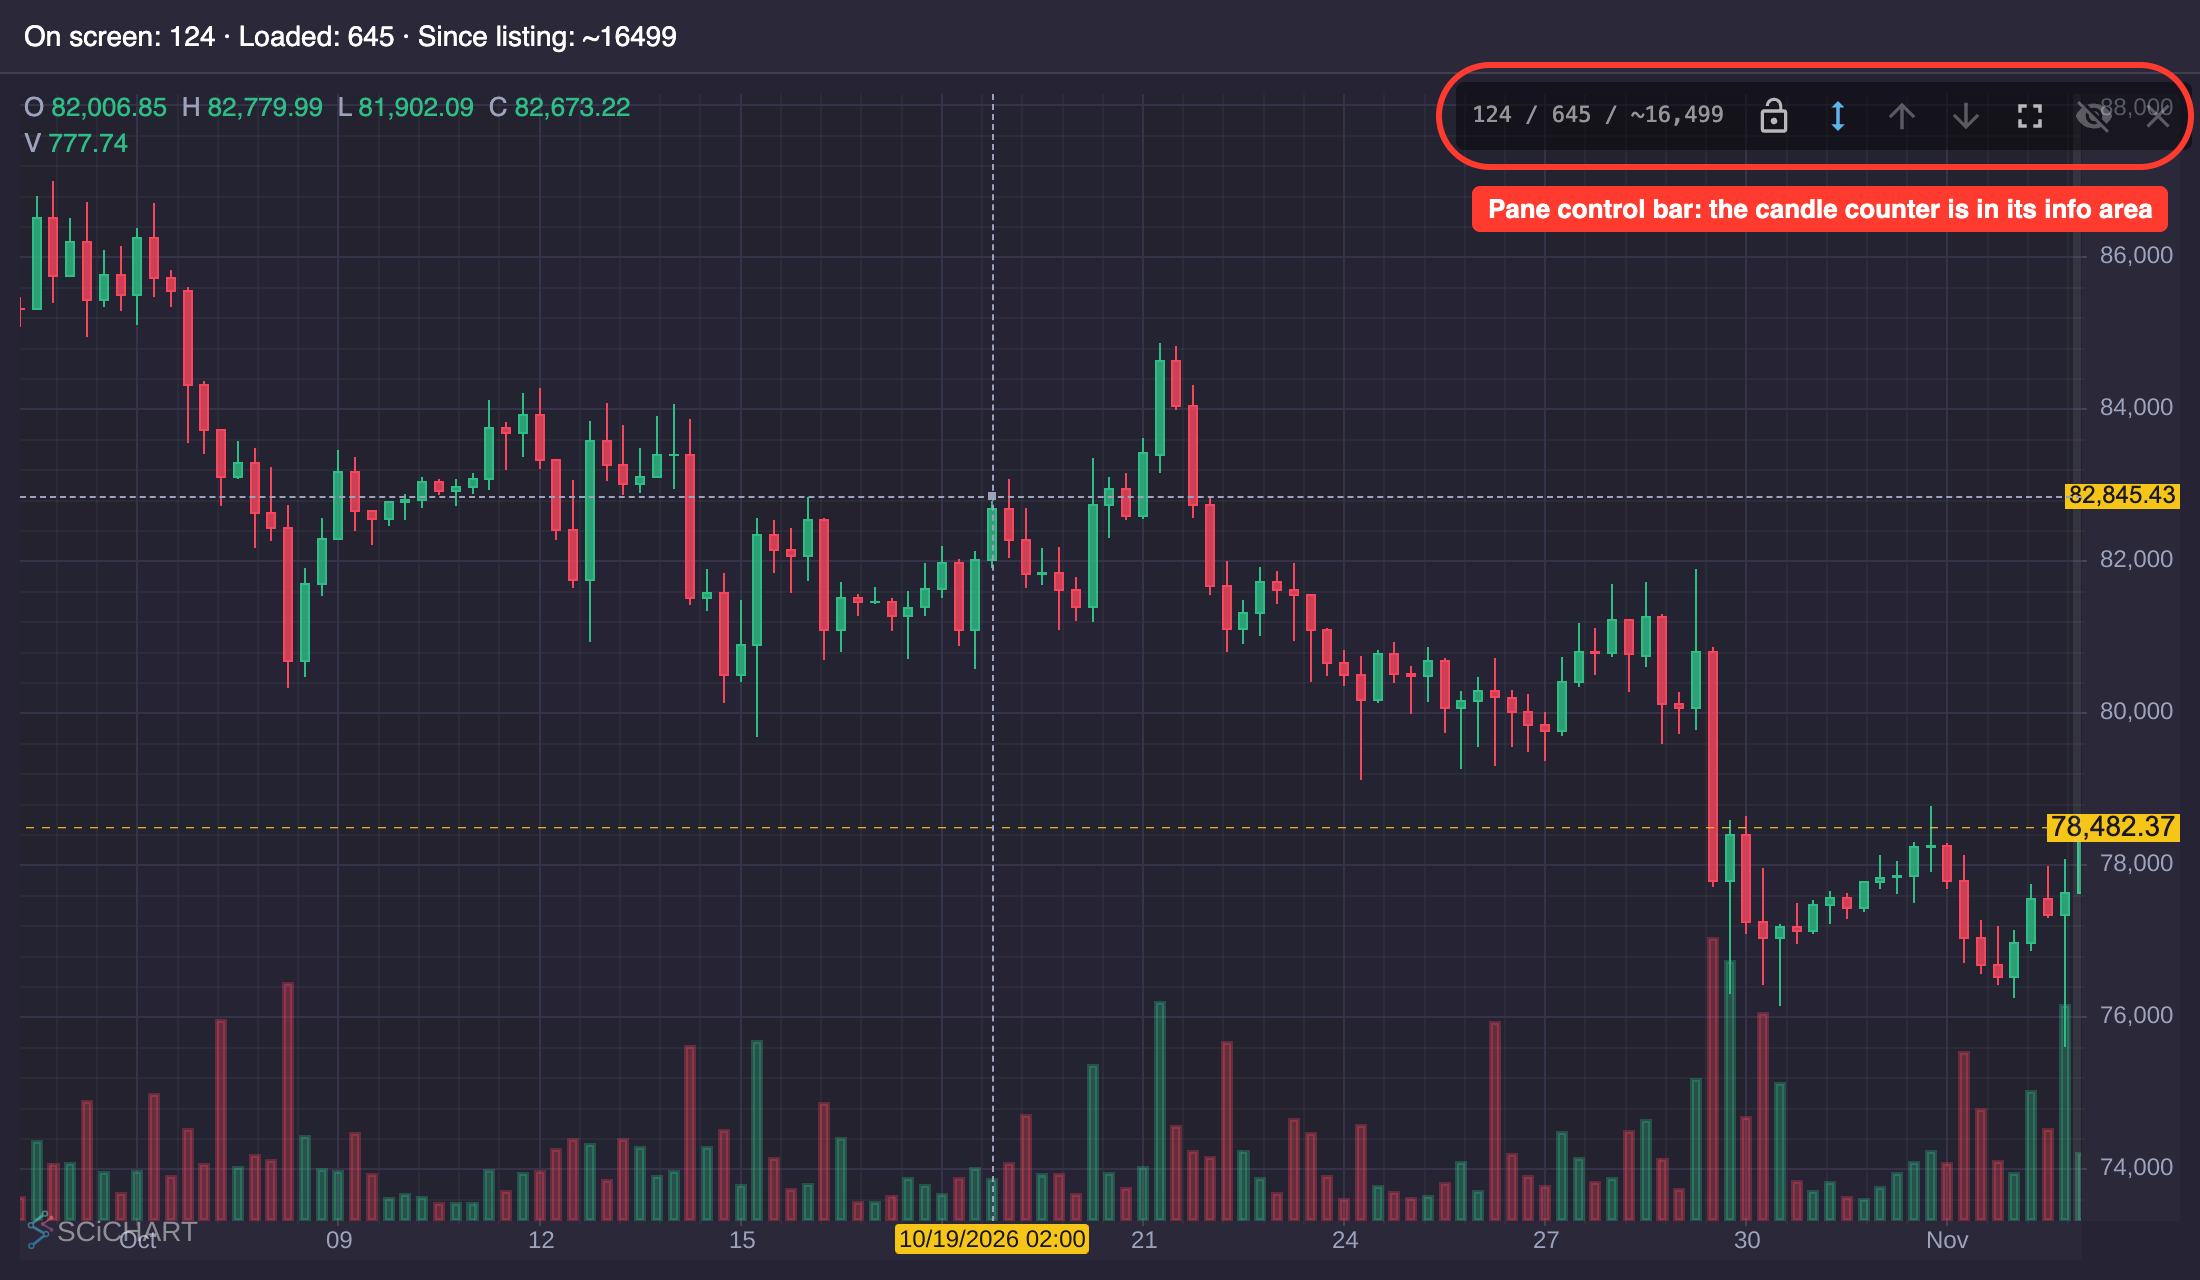
A candle counter in the price pane's control bar, circled. The line above the chart is the example's own toolbar.
TypeScript Example: Candle Counter
A six-hour chart of BTC-USD from Coinbase. A CandleCounter sits in the price pane's control bar, reached with getPaneInfoElement; hover over the chart to see the bar, at the top right. The toolbar shows the same numbers with observeCandleCounts. Zoom or pan to see them change.
The code for this example is found below.
- TS
import "scichart-scitrader/scitrader.css";
import {
    CandleCounter,
    CandleInterval,
    CoinbaseExchange,
    defaultExchangeProvider,
    idbPriceStore,
    observeCandleCounts,
    OHLCStudy,
    PaneId,
    SciFinanceChartPanel,
    VolumeStudy,
} from "scichart-scitrader";

// This example expects this HTML:
// <div style="display: flex; flex-direction: column; height: 100%">
//     <div id="toolbar"></div>
//     <div id="chart" style="flex: 1; min-height: 0"></div>
// </div>

// Register a data source, once, at app startup
defaultExchangeProvider.registerExchange(CoinbaseExchange, idbPriceStore);

async function createChart() {
    const toolbar = document.getElementById("toolbar");
    Object.assign(toolbar.style, toolbarStyle);

    const financeChartPanel = await SciFinanceChartPanel.create(document.getElementById("chart"), {
        exchangeName: CoinbaseExchange.name, // name="Coinbase" matches the built-in CoinbaseExchange
        symbol: "BTC-USD",
        interval: CandleInterval.SIX_HOURS,
        period: "1M",
        studies: [new OHLCStudy(), new VolumeStudy()],
    });
    const chart = financeChartPanel.financeApi; // SciFinanceChart

    // 1. CandleCounter in the price pane's control bar.
    // getPaneInfoElement(paneId) returns the info area at the start of that pane's control bar.
    // The price pane's id is PaneId.DEFAULT.value ("default")
    const infoArea = financeChartPanel.getPaneInfoElement(PaneId.DEFAULT.value);
    const counter = CandleCounter.create(infoArea, { chart });

    // 2. The same numbers in your own element, with observeCandleCounts.
    // It calls back now and whenever the counts change, at most once a frame, and returns a
    // function that stops it. A count is undefined while it is still unknown
    const status = document.createElement("span");
    toolbar.appendChild(status);
    const stopObserving = observeCandleCounts(chart, (counts) => {
        status.textContent =
            `On screen: ${counts?.visible ?? "?"} · Loaded: ${counts?.loaded ?? "?"} · ` +
            `Since listing: ~${counts?.total ?? "?"}`;
    });

    // When the page goes away: stopObserving(); counter.destroy(); financeChartPanel.cleanup();
    return { financeChartPanel, counter, stopObserving };
}

// The toolbar uses SciTrader's UI colours: its --st-ui-* CSS variables, with the stylesheet's defaults
const toolbarStyle: Partial<CSSStyleDeclaration> = {
    padding: "10px 12px",
    background: "var(--st-ui-background, #2b2839)",
    borderBottom: "1px solid var(--st-ui-divider, rgba(255,255,255,0.1))",
    color: "var(--st-ui-text, #ffffff)",
    fontFamily: "var(--st-font-family, sans-serif)",
    fontSize: "14px",
};

createChart();
React Example: Candle Counter
The same chart in React. SciFinanceChartView's paneInfo prop puts the React CandleCounter in the price pane's control bar, and the toolbar shows the numbers with observeCandleCounts.
The code for this example is found below.
- React
import "scichart-scitrader/scitrader.css";
import * as React from "react";
import {
    CandleInterval,
    CoinbaseExchange,
    defaultExchangeProvider,
    ICandleCounts,
    idbPriceStore,
    ISciFinanceChartPanelApi,
    ISciFinanceChartPanelConfig,
    observeCandleCounts,
    OHLCStudy,
    PaneId,
    VolumeStudy,
} from "scichart-scitrader";
import { CandleCounter, SciFinanceChartView } from "scichart-scitrader-react";

// Register a data source, once, at app startup
defaultExchangeProvider.registerExchange(CoinbaseExchange, idbPriceStore);

export function CandleCounterChart() {
    // The chart's API, once it has initialised: CandleCounter needs its financeApi
    const [chart, setChart] = React.useState<ISciFinanceChartPanelApi>();
    const [counts, setCounts] = React.useState<ICandleCounts>();

    const config = React.useMemo<ISciFinanceChartPanelConfig>(
        () => ({
            exchangeName: CoinbaseExchange.name, // name="Coinbase" matches the built-in CoinbaseExchange
            symbol: "BTC-USD",
            interval: CandleInterval.SIX_HOURS,
            period: "1M",
            studies: [new OHLCStudy(), new VolumeStudy()],
        }),
        []
    );

    // The same numbers in your own element, with observeCandleCounts. It returns a function that
    // stops it, which is the effect's cleanup
    React.useEffect(() => (chart ? observeCandleCounts(chart.financeApi, setCounts) : undefined), [chart]);

    // Fills its parent, so give the parent a height
    return (
        <div style={{ display: "flex", flexDirection: "column", height: "100%" }}>
            <div style={toolbarStyle}>
                On screen: {counts?.visible ?? "?"} · Loaded: {counts?.loaded ?? "?"} · Since listing: ~
                {counts?.total ?? "?"}
            </div>
            <div style={{ flex: 1, minHeight: 0 }}>
                <SciFinanceChartView
                    config={config}
                    onInit={setChart}
                    // paneInfo is called for every chart pane, with the pane's id. Whatever it returns
                    // is rendered in that pane's control bar; null leaves the area empty.
                    // Here: a CandleCounter in the price pane (PaneId.DEFAULT.value, "default") only
                    paneInfo={(paneId: string) =>
                        paneId === PaneId.DEFAULT.value && chart ? <CandleCounter chart={chart.financeApi} /> : null
                    }
                />
            </div>
        </div>
    );
}

// The toolbar uses SciTrader's UI colours: its --st-ui-* CSS variables, with the stylesheet's defaults
const toolbarStyle: React.CSSProperties = {
    padding: "10px 12px",
    background: "var(--st-ui-background, #2b2839)",
    borderBottom: "1px solid var(--st-ui-divider, rgba(255,255,255,0.1))",
    color: "var(--st-ui-text, #ffffff)",
    fontFamily: "var(--st-font-family, sans-serif)",
    fontSize: 14,
};
Showing It in the Pane Control Bar
Each chart pane has a pane control bar: a strip of buttons over the top right of the pane, which appears when you hover over the pane. Its buttons lock the pane's size, toggle the Y axis's auto-range, move, maximise, hide and close the pane (Pane controls). The bar starts with an info area for your own content, which is hidden while it is empty.
In the screenshot below, from the example above, the candle counter ("124 / 645 / ~16,499") is in the price pane's control bar, circled. The line above the chart is the example's own toolbar, which shows the same counts with observeCandleCounts.
The pane control bar, circled, with the candle counter in its info area
Plain TypeScript and React reach the info area differently:
| Plain TypeScript | React | |
|---|---|---|
| How | finance returns the area's element; put your content in it | <: return the content for each pane |
| Declared on | ISci | ISci |
| Signature | get | pane |
| Returns | The element, or undefined if there is no such pane | Your content, or null to leave that pane's area empty |
| Candle counter | Candle | < |
The pane id. paneId is a pane's id as a string: PaneId.value. The price pane's id is PaneId.DEFAULT.value, which is "default". Other panes, such as a study's oscillator pane, have their own ids. In React, paneInfo is called for every chart pane, so check the id and return null for the panes that should stay empty:
import { PaneId } from "scichart-scitrader";
import { CandleCounter, SciFinanceChartView } from "scichart-scitrader-react";

<SciFinanceChartView
    config={config}
    onInit={setChart} // CandleCounter needs the chart's financeApi, so keep the API once it's ready
    // Called for every chart pane, with its id. Return content for the price pane, null for the rest
    paneInfo={(paneId: string) =>
        paneId === PaneId.DEFAULT.value && chart ? <CandleCounter chart={chart.financeApi} /> : null
    }
/>
import { CandleCounter, PaneId } from "scichart-scitrader";

// The info area of the price pane's control bar
const infoArea = financeChartPanel.getPaneInfoElement(PaneId.DEFAULT.value);
CandleCounter.create(infoArea, { chart: financeChartPanel.financeApi });
The info area is not only for the candle counter: put any content there, such as the symbol, or a status. See Your own content in the control bar.
ISciFinanceChartPanelApi.getPaneInfoElement and ISciFinanceChartViewProps.paneInfo, with their TSDoc
// ISciFinanceChartPanelApi (plain TypeScript)
/**
 * The info area at the start of a pane's control bar, for the host's own content, such as a
 * candle counter on the price pane (`PaneId.DEFAULT.value`). Hidden while empty. The same
 * element is kept while the pane exists. `undefined` if there is no such pane.
 */
getPaneInfoElement(paneId: string): HTMLElement | undefined;

// ISciFinanceChartViewProps (React)
/**
 * Content for the info area at the start of a chart pane's control bar, such as a candle
 * counter. Called for every chart pane; return `null` to leave a pane's area empty.
 */
paneInfo?: (paneId: string) => React.ReactNode;
The Counts Alone: countCandles and observeCandleCounts
For the numbers without the counter's text, for example to show them your own way:
countCandles(chart)counts once, and returns{ visible, loaded, total }, orundefinedbefore the chart has a price pane.observeCandleCounts(chart, onChange)callsonChangewith the counts now, then whenever candles arrive or the view changes, at most once a frame. It returns a function that stops it: call it when your element goes away, or return it from a React effect.
import { countCandles, observeCandleCounts } from "scichart-scitrader";

const chart = financeChartPanel.financeApi;

// Once
const counts = countCandles(chart); // e.g. { visible: 120, loaded: 640, total: 16000 }

// As they change. A count is undefined while it is still unknown
const stop = observeCandleCounts(chart, (counts) => {
    status.textContent = `${counts?.visible ?? "?"} of ${counts?.loaded ?? "?"} candles on screen`;
});
stop(); // when the page goes away
The CandleCounter class, ICandleCounterOptions and ICandleCounts, with their TSDoc
/**
 * The price pane's candle counts as text, "visible / loaded / ~total", in plain DOM, kept up to
 * date as candles load and the user pans or zooms. Unknown counts show as "?". Made for the info
 * area of a pane's control bar (`panel.getPaneInfoElement(paneId)`, or `paneInfo` in React). The
 * look is `.st-candle-counter` in `scitrader.css`.
 *
 * ```ts
 * CandleCounter.create(panel.getPaneInfoElement(PaneId.DEFAULT.value), { chart: panel.financeApi });
 * ```
 *
 * React apps use the React `CandleCounter`. For the numbers alone, see {@link observeCandleCounts}.
 */
class CandleCounter {
    /** The counter, inside the container passed to {@link create}. */
    readonly element: HTMLSpanElement;
    static create(container: HTMLElement, options: ICandleCounterOptions): CandleCounter;
    /** The counts shown, or `undefined` before the chart has a price pane. */
    get counts(): ICandleCounts | undefined;
    /** Change any of the options; the ones not given stay as they are. */
    update(options: Partial<ICandleCounterOptions>): void;
    destroy(): void;
}

/** Options for {@link CandleCounter}. */
interface ICandleCounterOptions {
    /** The chart whose price pane to count: `panel.financeApi`. */
    chart: SciFinanceChart;
}

/** Candle counts for a chart's price pane. A field is `undefined` while still unknown. */
interface ICandleCounts {
    /** Candles currently on screen. */
    visible?: number;
    /** Candles loaded into the chart. */
    loaded?: number;
    /** Estimated candles since the symbol's listing date, once the feed knows it. */
    total?: number;
}
countCandles and observeCandleCounts, with their TSDoc
/**
 * Count the price pane's candles: on screen, loaded, and the estimated total since the symbol's
 * listing. `undefined` before the chart has a price pane.
 */
function countCandles(chart: SciFinanceChart): ICandleCounts | undefined;

/**
 * Call `onChange` with the chart's candle counts now, then whenever candles arrive or the visible
 * range changes: at most once per animation frame, so a fast pan doesn't recount 60+ times a
 * second for nothing. Returns a function that stops it.
 */
function observeCandleCounts(chart: SciFinanceChart, onChange: (counts: ICandleCounts | undefined) => void): () => void;
The React CandleCounter and its props, with their TSDoc
/** Props for {@link CandleCounter}. */
interface ICandleCounterProps {
    /** The chart whose price pane to count: `api.financeApi`. */
    chart: SciFinanceChart;
    className?: string;
    style?: React.CSSProperties;
}

/**
 * The SDK's candle counter in React: "visible / loaded / ~total" for the price pane, kept up to
 * date by the vanilla `CandleCounter`, not by React state, so it doesn't re-render the page as the
 * chart moves. Made for `SciFinanceChartView`'s `paneInfo`:
 *
 * ```tsx
 * <SciFinanceChartView
 *     config={config}
 *     onInit={setChart}
 *     paneInfo={(paneId) => (paneId === PaneId.DEFAULT.value && chart ? <CandleCounter chart={chart.financeApi} /> : null)}
 * />
 * ```
 */
function CandleCounter({ chart, className, style }: ICandleCounterProps): JSX.Element;
Styling the Candle Counter
The counter is a <span class="st-candle-counter">. In a control bar it takes the info area's look, .st-pane-control-bar__info. These are the stylesheet's rules:
.st-candle-counter {
    white-space: nowrap;
}

.st-pane-control-bar__info {
    padding: 0 8px 0 6px;
    font-family: "SF Mono", Menlo, Consolas, monospace;
    font-size: 11px;
    line-height: 20px;
    color: rgb(var(--st-ui-overlay-rgb, 255 255 255) / 0.55);
    white-space: nowrap;
    user-select: none;
}

.st-pane-control-bar__info:empty {
    display: none;
}
Override them in your own CSS, loaded after scitrader.css:
/* A larger counter, in the theme's text colour */
.st-pane-control-bar__info .st-candle-counter {
    font-size: 12px;
    color: var(--st-ui-text, #ffffff);
}
See Styling and Themes.