HorizontalLineAnnotation
The HorizontalLineAnnotation allows to draw a horizontal line between X1, X2 coordinates at Y1.
Declaring a HorizontalLineAnnotation in code
The following code will declare a HorizontalLineAnnotation📘 and add it to the chart.
- TS
- Builder API (JSON Config)
const { HorizontalLineAnnotation, NumericAxis, SciChartSurface, ELabelPlacement, SciChartJsNavyTheme } = SciChart;
// or for npm import { SciChartSurface, ... } from "scichart"

async function addAnnotationToChart(divElementId) {
    const { wasmContext, sciChartSurface } = await SciChartSurface.create(divElementId, {
        theme: new SciChartJsNavyTheme()
    });
    sciChartSurface.xAxes.add(new NumericAxis(wasmContext));
    sciChartSurface.yAxes.add(new NumericAxis(wasmContext));

    // Add a selection of annotations to the chart
    sciChartSurface.annotations.add(
        // Vertically line stretched across the viewport, showing label value = X (9)
        new HorizontalLineAnnotation({
            labelPlacement: ELabelPlacement.Axis,
            showLabel: true,
            stroke: "#FF6600",
            strokeThickness: 2,
            y1: 4,
            axisLabelFill: "#FF6600",
            axisLabelStroke: "#333",
            axisFontSize: 20
        }),
        // Vertically line with a custom label value
        new HorizontalLineAnnotation({
            labelPlacement: ELabelPlacement.Axis,
            showLabel: true,
            stroke: "#3388FF",
            strokeThickness: 2,
            strokeDashArray: [5, 5],
            y1: 9,
            axisLabelFill: "#3388FF",
            labelValue: "Custom Label",
            axisLabelStroke: "White",
            axisFontSize: 20
        })
    );
}

addAnnotationToChart("scichart-root");
const { chartBuilder, EAnnotationType } = SciChart;
// or for npm import { SciChartSurface, ... } from "scichart"

const { wasmContext, sciChartSurface } = await chartBuilder.build2DChart(divElementId, {
    annotations: [
        {
            type: EAnnotationType.RenderContextHorizontalLineAnnotation,
            options: {
                labelPlacement: ELabelPlacement.Axis,
                showLabel: true,
                stroke: "#FF6600",
                strokeThickness: 2,
                y1: 4,
                axisLabelFill: "#FF6600",
                axisLabelStroke: "#333",
                axisFontSize: 20
            }
        },
        {
            type: EAnnotationType.RenderContextHorizontalLineAnnotation,
            options: {
                labelPlacement: ELabelPlacement.Axis,
                showLabel: true,
                stroke: "#3388FF",
                strokeThickness: 2,
                strokeDashArray: [5, 5],
                y1: 9,
                axisLabelFill: "#3388FF",
                labelValue: "Custom Label",
                axisLabelStroke: "White",
                axisFontSize: 20
            }
        }
    ]
});
This results in the following output:
Changing Label Position or Label Value
The label may be placed on the line, or on the axis. Placemement of the label is controlled by the HorizontalLineAnnotation.labelPlacement📘 property, which expects an ELabelPlacement📘 enum.
Valid settings are Axis, Bottom, BottomLeft, BottomRight, Top, TopLeft, TopRight, Left and Right.
For example, setting labelPlacement to ELabelPlacement.TopLeft:
- TS
- Builder API (JSON Config)
// Add a selection of annotations to the chart
sciChartSurface.annotations.add(
    // Vertically line stretched across the viewport, showing label value = X (9)
    new HorizontalLineAnnotation({
        labelPlacement: ELabelPlacement.TopRight,
        showLabel: true,
        stroke: "#FF6600",
        strokeThickness: 2,
        y1: 9,
        axisLabelFill: "#FF6600",
        axisLabelStroke: "#333",
        axisFontSize: 20
    }),
    // Vertically line with a custom label value
    new HorizontalLineAnnotation({
        labelPlacement: ELabelPlacement.TopLeft,
        showLabel: true,
        stroke: "#3388FF",
        strokeThickness: 2,
        strokeDashArray: [5, 5],
        y1: 4,
        axisLabelFill: "#3388FF",
        labelValue: "Custom Label",
        axisLabelStroke: "White",
        axisFontSize: 20
    })
);
const { chartBuilder, EAnnotationType } = SciChart;
// or for npm import { SciChartSurface, ... } from "scichart"

const { wasmContext, sciChartSurface } = await chartBuilder.build2DChart(divElementId, {
    annotations: [
        {
            type: EAnnotationType.RenderContextHorizontalLineAnnotation,
            options: {
                labelPlacement: ELabelPlacement.TopRight,
                showLabel: true,
                stroke: "#FF6600",
                strokeThickness: 2,
                y1: 9,
                axisLabelFill: "#FF6600",
                axisLabelStroke: "#333",
                axisFontSize: 20
            }
        },
        {
            type: EAnnotationType.RenderContextHorizontalLineAnnotation,
            options: {
                labelPlacement: ELabelPlacement.TopLeft,
                showLabel: true,
                stroke: "#3388FF",
                strokeThickness: 2,
                strokeDashArray: [5, 5],
                y1: 4,
                axisLabelFill: "#3388FF",
                labelValue: "Custom Label",
                axisLabelStroke: "White",
                axisFontSize: 20
            }
        }
    ]
});
Results in the label being placed on the top left of the line.
Labels on HorizontalLineAnnotations📘 may be placed on the Axis, or at Bottom, BottomLeft, BottomRight, Top, TopLeft, TopRight, Left or Right of the line.
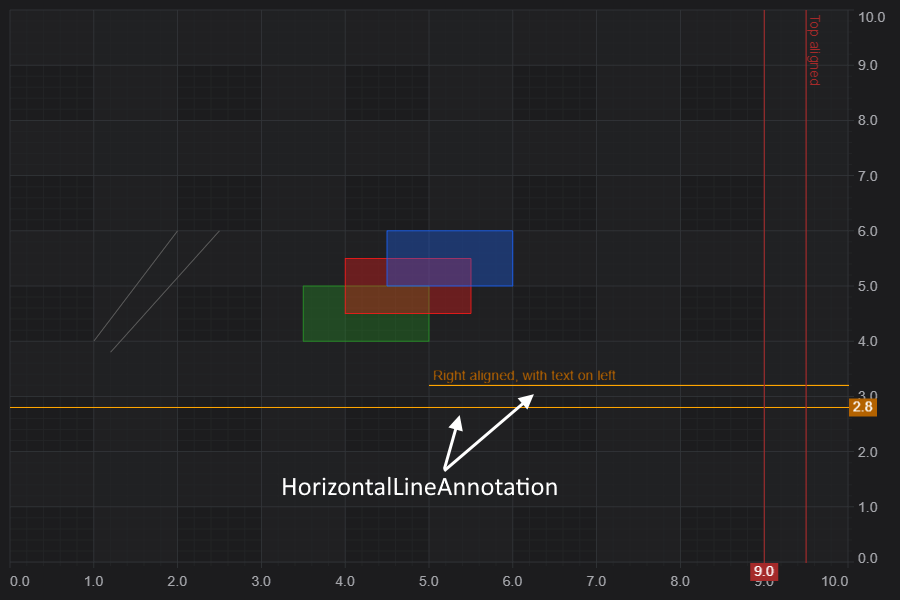
HorizontalAlignment Stretch and Partially Drawn Lines
HorizontalLineAnnotations📘 may be drawn to stretch vertically across the viewport, or to a specific Y-value. To truncate a VerticalLineAnnotation simply specify a y1 coordinate.
For example, the two options are shown below in code:
- TS
- Builder API (JSON Config)
const { HorizontalLineAnnotation, NumericAxis, SciChartSurface, ELabelPlacement, SciChartJsNavyTheme } = SciChart;
// or for npm import { SciChartSurface, ... } from "scichart"

async function addAnnotationToChart(divElementId) {
    const { wasmContext, sciChartSurface } = await SciChartSurface.create(divElementId, {
        theme: new SciChartJsNavyTheme()
    });
    sciChartSurface.xAxes.add(new NumericAxis(wasmContext));
    sciChartSurface.yAxes.add(new NumericAxis(wasmContext));

    // Add a selection of annotations to the chart
    sciChartSurface.annotations.add(
        // Horizontal line stretched across the viewport, showing label value = Y (9)
        new HorizontalLineAnnotation({
            labelPlacement: ELabelPlacement.Axis,
            showLabel: true,
            stroke: "SteelBlue",
            strokeThickness: 2,
            y1: 9,
            axisLabelFill: "SteelBlue",
            axisFontSize: 20
        }),
        // Horizontal line with a custom label value partially stretched to X=4
        new HorizontalLineAnnotation({
            showLabel: true,
            stroke: "Orange",
            strokeThickness: 2,
            y1: 6,
            x1: 4, // only draw up to X=4
            axisLabelFill: "Orange",
            axisFontSize: 20
        })
    );
}

addAnnotationToChart("scichart-root");
const { chartBuilder, EAnnotationType } = SciChart;
// or for npm import { SciChartSurface, ... } from "scichart"

const { wasmContext, sciChartSurface } = await chartBuilder.build2DChart(divElementId, {
    annotations: [
        {
            type: EAnnotationType.RenderContextHorizontalLineAnnotation,
            options: {
                labelPlacement: ELabelPlacement.Axis,
                showLabel: true,
                stroke: "SteelBlue",
                strokeThickness: 2,
                y1: 9,
                axisLabelFill: "SteelBlue",
                axisFontSize: 20
            }
        },
        {
            type: EAnnotationType.RenderContextHorizontalLineAnnotation,
            options: {
                showLabel: true,
                stroke: "Orange",
                strokeThickness: 2,
                y1: 6,
                x1: 4, // only draw up to X=4
                axisLabelFill: "Orange",
                axisFontSize: 20
            }
        }
    ]
});
Result in this output.
Styling the HorizontalLineAnnotation
The following properties can be set to style the HorizontalLineAnnotation📘:
| Property | Description |
|---|---|
| labelPlacement📘 | An enumeration defining where the vertical line label is placed. Default is on axis. |
| labelValue📘 | The label value. By default this will equal the x1 value with text formatting applied by the axis. However it can be overridden to any string |
| showLabel📘 | When true, a label is shown |
| stroke📘 | The stroke color of the vertical line |
| strokeDashArray📘 | Defines the dash pattern for the stroke |
| strokeThickness📘 | The stroke thickness of the vertical line |
| axisLabelFill📘 | The box fill color for the axis label |
| axisLabelStroke📘 | The text-color for the axis label |
| axisFontFamily📘 | The font family for the axis label text |
| axisFontSize📘 | The font size for the axis label text |