LineAnnotation
The LineAnnotation📘 draws a line of variable thickness from x1, y1 to x2, y2 where coordinates are data-values. The LineAnnotation supports strokeThickness📘, stroke📘 properties.
Coordinates may be relative, absolute or data-value based, to both xCoordinateMode📘, yCoordinateMode📘 properties as values of ECoordinateMode📘 enum.
Declaring a LineAnnotation in code
The following code will declare a number of LineAnnotations📘 and add them to the chart.
- TS
- Builder API (JSON Config)
const {
    LineAnnotation,
    TextAnnotation,
    NumericAxis,
    SciChartSurface,
    SciChartJsNavyTheme
} = SciChart;
// or for npm import { SciChartSurface, ... } from "scichart"

async function addAnnotationToChart(divElementId) {
    const { wasmContext, sciChartSurface } = await SciChartSurface.create(divElementId, {
        theme: new SciChartJsNavyTheme()
    });
    sciChartSurface.xAxes.add(new NumericAxis(wasmContext));
    sciChartSurface.yAxes.add(new NumericAxis(wasmContext));

    // Add a selection of annotations to the chart
    sciChartSurface.annotations.add(
        new TextAnnotation({
            fontSize: 16,
            text: "In SciChart.js, you can add arbitrary lines",
            x1: 0.3,
            y1: 6.3
        }),

        new LineAnnotation({
            stroke: "#3399FF",
            strokeThickness: 3,
            x1: 1,
            x2: 6,
            y1: 1,
            y2: 8
        }),
        new LineAnnotation({
            stroke: "#FF6600",
            strokeThickness: 3,
            strokeDashArray: [5, 5],
            x1: 1.5,
            x2: 8,
            y1: 1,
            y2: 7
        })
    );
}

addAnnotationToChart("scichart-root");
const { chartBuilder, EAnnotationType } = SciChart;
// or for npm import { SciChartSurface, ... } from "scichart"
const { wasmContext, sciChartSurface } = await chartBuilder.build2DChart(divElementId, {
annotations: [
{
type: EAnnotationType.SVGTextAnnotation,
options: {
fontSize: 12,
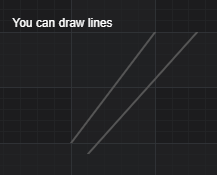
text: "You can draw lines",
x1: 0.3,
y1: 6.3
}
},
{
type: EAnnotationType.RenderContextLineAnnotation,
options: {
stroke: "#3399FF",
strokeThickness: 3,
x1: 1,
x2: 2,
y1: 4,
y2: 6
}
},
{
type: EAnnotationType.RenderContextLineAnnotation,
options: {
stroke: "#FF6600",
strokeThickness: 3,
strokeDashArray: [5, 5],
x1: 1.2,
x2: 2.5,
y1: 3.8,
y2: 6
}
}
]
});
This results in the following output:
Aligning a LineAnnotation with x/yCoordinateModes
To position a LineAnnotation📘 so that it stretches horizontally or vertically across the viewport, use x/yCoordinateMode. e.g. the following code:
- TS
- Builder API (JSON Config)
// Add LineAnnotations with Horizontal and Vertical Stretching
sciChartSurface.annotations.add(
    new TextAnnotation({
        text: "Horizontally Stretched Line uses xCoordinateMode.Relative",
        x1: 0.1,
        y1: 2.5
    }),

    new LineAnnotation({
        stroke: "#279B27",
        strokeThickness: 3,

        xCoordinateMode: ECoordinateMode.Relative, // from 0.0 to 1.0 of chart width
        x1: 0.0, // from left edge of chart
        x2: 1.0, // .. to right edge of chart

        yCoordinateMode: ECoordinateMode.DataValue,
        y1: 2, // coordinate value
        y2: 2
    }),

    new TextAnnotation({
        text: "Vertically Stretched Line uses yCoordinateMode.Relative",
        x1: 2.1,
        y1: 9.2
    }),

    new LineAnnotation({
        stroke: "#FF1919",
        strokeThickness: 3,

        xCoordinateMode: ECoordinateMode.DataValue,
        x1: 2, // coordinate value
        x2: 2,

        yCoordinateMode: ECoordinateMode.Relative, // from 0.0 to 1.0 of chart height
        y1: 0.0,
        y2: 1.0
    })
);
const { chartBuilder, EAnnotationType } = SciChart;
// or for npm import { SciChartSurface, ... } from "scichart"

const { wasmContext, sciChartSurface } = await chartBuilder.build2DChart(divElementId, {
    annotations: [
        {
            type: EAnnotationType.SVGTextAnnotation,
            options: {
                text: "Horizontally Stretched Line uses xCoordinateMode.Relative",
                x1: 0.1,
                y1: 2.5
            }
        },
        {
            type: EAnnotationType.RenderContextLineAnnotation,
            options: {
                stroke: "#279B27",
                strokeThickness: 3,
                xCoordinateMode: ECoordinateMode.Relative,
                x1: 0,
                x2: 1,
                yCoordinateMode: ECoordinateMode.DataValue,
                y1: 2,
                y2: 2
            }
        },
        {
            type: EAnnotationType.SVGTextAnnotation,
            options: {
                text: "Vertically Stretched Line uses yCoordinateMode.Relative",
                x1: 2.1,
                y1: 9.2
            }
        },
        {
            type: EAnnotationType.RenderContextLineAnnotation,
            options: {
                stroke: "#FF1919",
                strokeThickness: 3,
                xCoordinateMode: ECoordinateMode.DataValue,
                x1: 2,
                x2: 2,
                yCoordinateMode: ECoordinateMode.Relative,
                y1: 0.0,
                y2: 1.0
            }
        }
    ]
});
results in this output:
Polar Charts with LineAnnotation
To add a LineAnnotation📘 to a Polar chart, use the same exact code, just change the surface and axes types. The LineAnnotation will be positioned in polar coordinates.
- TS
- Builder API (JSON Config)
const {
    LineAnnotation,
    TextAnnotation,
    PolarNumericAxis,
    SciChartPolarSurface,
    SciChartJsNavyTheme,
    EPolarAxisMode,
    EHorizontalAnchorPoint,
    Thickness
} = SciChart;
// or for npm import { SciChartPolarSurface, ... } from "scichart"

async function addAnnotationToChart(divElementId) {
    const { wasmContext, sciChartSurface } = await SciChartPolarSurface.create(divElementId, {
        theme: new SciChartJsNavyTheme()
    });

    const angularAxis = new PolarNumericAxis(wasmContext, {
        polarAxisMode: EPolarAxisMode.Angular,
    });
    sciChartSurface.xAxes.add(angularAxis);

    const radialAxis = new PolarNumericAxis(wasmContext, {
        polarAxisMode: EPolarAxisMode.Radial,
    });
    sciChartSurface.yAxes.add(radialAxis);

    // Add a selection of annotations to the chart
    sciChartSurface.annotations.add(
        new TextAnnotation({
            fontSize: 16,
            text: "In SciChart.js, you can add arbitrary lines",
            x1: 0,
            y1: 0,
            horizontalAnchorPoint: EHorizontalAnchorPoint.Center,
            padding: new Thickness(40, 0, 0, 0)
        }),

        new LineAnnotation({
            stroke: "#3399FF",
            strokeThickness: 3,
            x1: 2,
            x2: 6,
            y1: 6,
            y2: 2
        }),
        new LineAnnotation({
            stroke: "#FF6600",
            strokeThickness: 3,
            strokeDashArray: [5, 5],
            x1: 1.5,
            x2: 3,
            y1: 2,
            y2: 7
        })
    );
}

addAnnotationToChart("scichart-root");
const { chartBuilder, EAnnotationType, EHorizontalAnchorPoint, Thickness } = SciChart;
// or for npm import { chartBuilder, ... } from "scichart"

const { wasmContext, sciChartSurface } = await chartBuilder.build2DPolarChart(divElementId, {
    annotations: [
        {
            type: EAnnotationType.SVGTextAnnotation,
            options: {
                text: "In SciChart.js, you can add arbitrary lines",
                fontSize: 16,
                x1: 0,
                y1: 0,
                horizontalAnchorPoint: EHorizontalAnchorPoint.Center,
                padding: new Thickness(40, 0, 0, 0)
            }
        },
        {
            type: EAnnotationType.RenderContextLineAnnotation,
            options: {
                stroke: "#3399FF",
                strokeThickness: 3,
                x1: 2,
                x2: 6,
                y1: 6,
                y2: 2
            }
        },
        {
            type: EAnnotationType.RenderContextLineAnnotation,
            options: {
                stroke: "#FF6600",
                strokeThickness: 3,
                strokeDashArray: [5, 5],
                x1: 1.5,
                x2: 3,
                y1: 2,
                y2: 7
            }
        }
    ]
});
This results in the following: