Hit-Test API for Band Series
The hitTest method on Band Series
The IHitTestProvider.hitTest method on FastBandRenderableSeries tests if the click was within the band body.
hitTest method on Band Series
const hitTestInfo = bandSeries.hitTestProvider.hitTest(premultipliedX, premultipliedY);
The algorithm is as follows:
- Find the nearest data point in X direction.
- Test if the click was within the band body and update HitTestInfo.isHit property.
This is the full example of the hitTest method on Band Series.
- TS
const { sciChartSurface, wasmContext } = await SciChartSurface.create(divId);
sciChartSurface.xAxes.add(new NumericAxis(wasmContext, { axisAlignment: EAxisAlignment.Top }));
sciChartSurface.yAxes.add(
    new NumericAxis(wasmContext, { axisAlignment: EAxisAlignment.Right, growBy: new NumberRange(0.4, 0.4) })
);
const dataSeries = new XyyDataSeries(wasmContext);
const POINTS = 1000;
const STEP = (3 * Math.PI) / POINTS;
for (let i = 0; i <= 1000; i++) {
    const k = 1 - i / 2000;
    dataSeries.append(i, Math.sin(i * STEP) * k * 0.7, Math.cos(i * STEP) * k);
}
const bandSeries = new FastBandRenderableSeries(wasmContext, {
    dataSeries,
    strokeThickness: 2
});
sciChartSurface.renderableSeries.add(bandSeries);
bandSeries.fill = "#279B2733";
bandSeries.fillY1 = "#FF191933";
bandSeries.stroke = "#FF1919FF";
bandSeries.strokeY1 = "#279B27FF";
// Add an SVG annotation to display the mouse click
const svgAnnotation = new CustomAnnotation({
    svgString: `<svg width="8" height="8"><circle cx="50%" cy="50%" r="4" fill="#FF0000"/></svg>`,
    isHidden: true,
    horizontalAnchorPoint: EHorizontalAnchorPoint.Center,
    verticalAnchorPoint: EVerticalAnchorPoint.Center
});
sciChartSurface.annotations.add(svgAnnotation);
sciChartSurface.domCanvas2D.addEventListener("mousedown", (mouseEvent: MouseEvent) => {
    const mouseClickX = mouseEvent.offsetX;
    const mouseClickY = mouseEvent.offsetY;
    console.log("mouseClickX", mouseClickX, "mouseClickY", mouseClickY);
    const premultipliedX = mouseEvent.offsetX * DpiHelper.PIXEL_RATIO;
    const premultipliedY = mouseEvent.offsetY * DpiHelper.PIXEL_RATIO;
    console.log("premultipliedX", premultipliedX, "premultipliedY", premultipliedY);
    // IHitTestProvider.hitTest
    const hitTestInfo = bandSeries.hitTestProvider.hitTest(premultipliedX, premultipliedY);
    svgAnnotation.x1 = hitTestInfo.hitTestPointValues.x;
    svgAnnotation.y1 = hitTestInfo.hitTestPointValues.y;
    svgAnnotation.isHidden = false;
    const resultDiv = document.getElementById("result");
    resultDiv.innerText = `isHit = ${hitTestInfo.isHit}`;
    console.log("hitTestInfo", hitTestInfo);
});
This gives us the chart below.
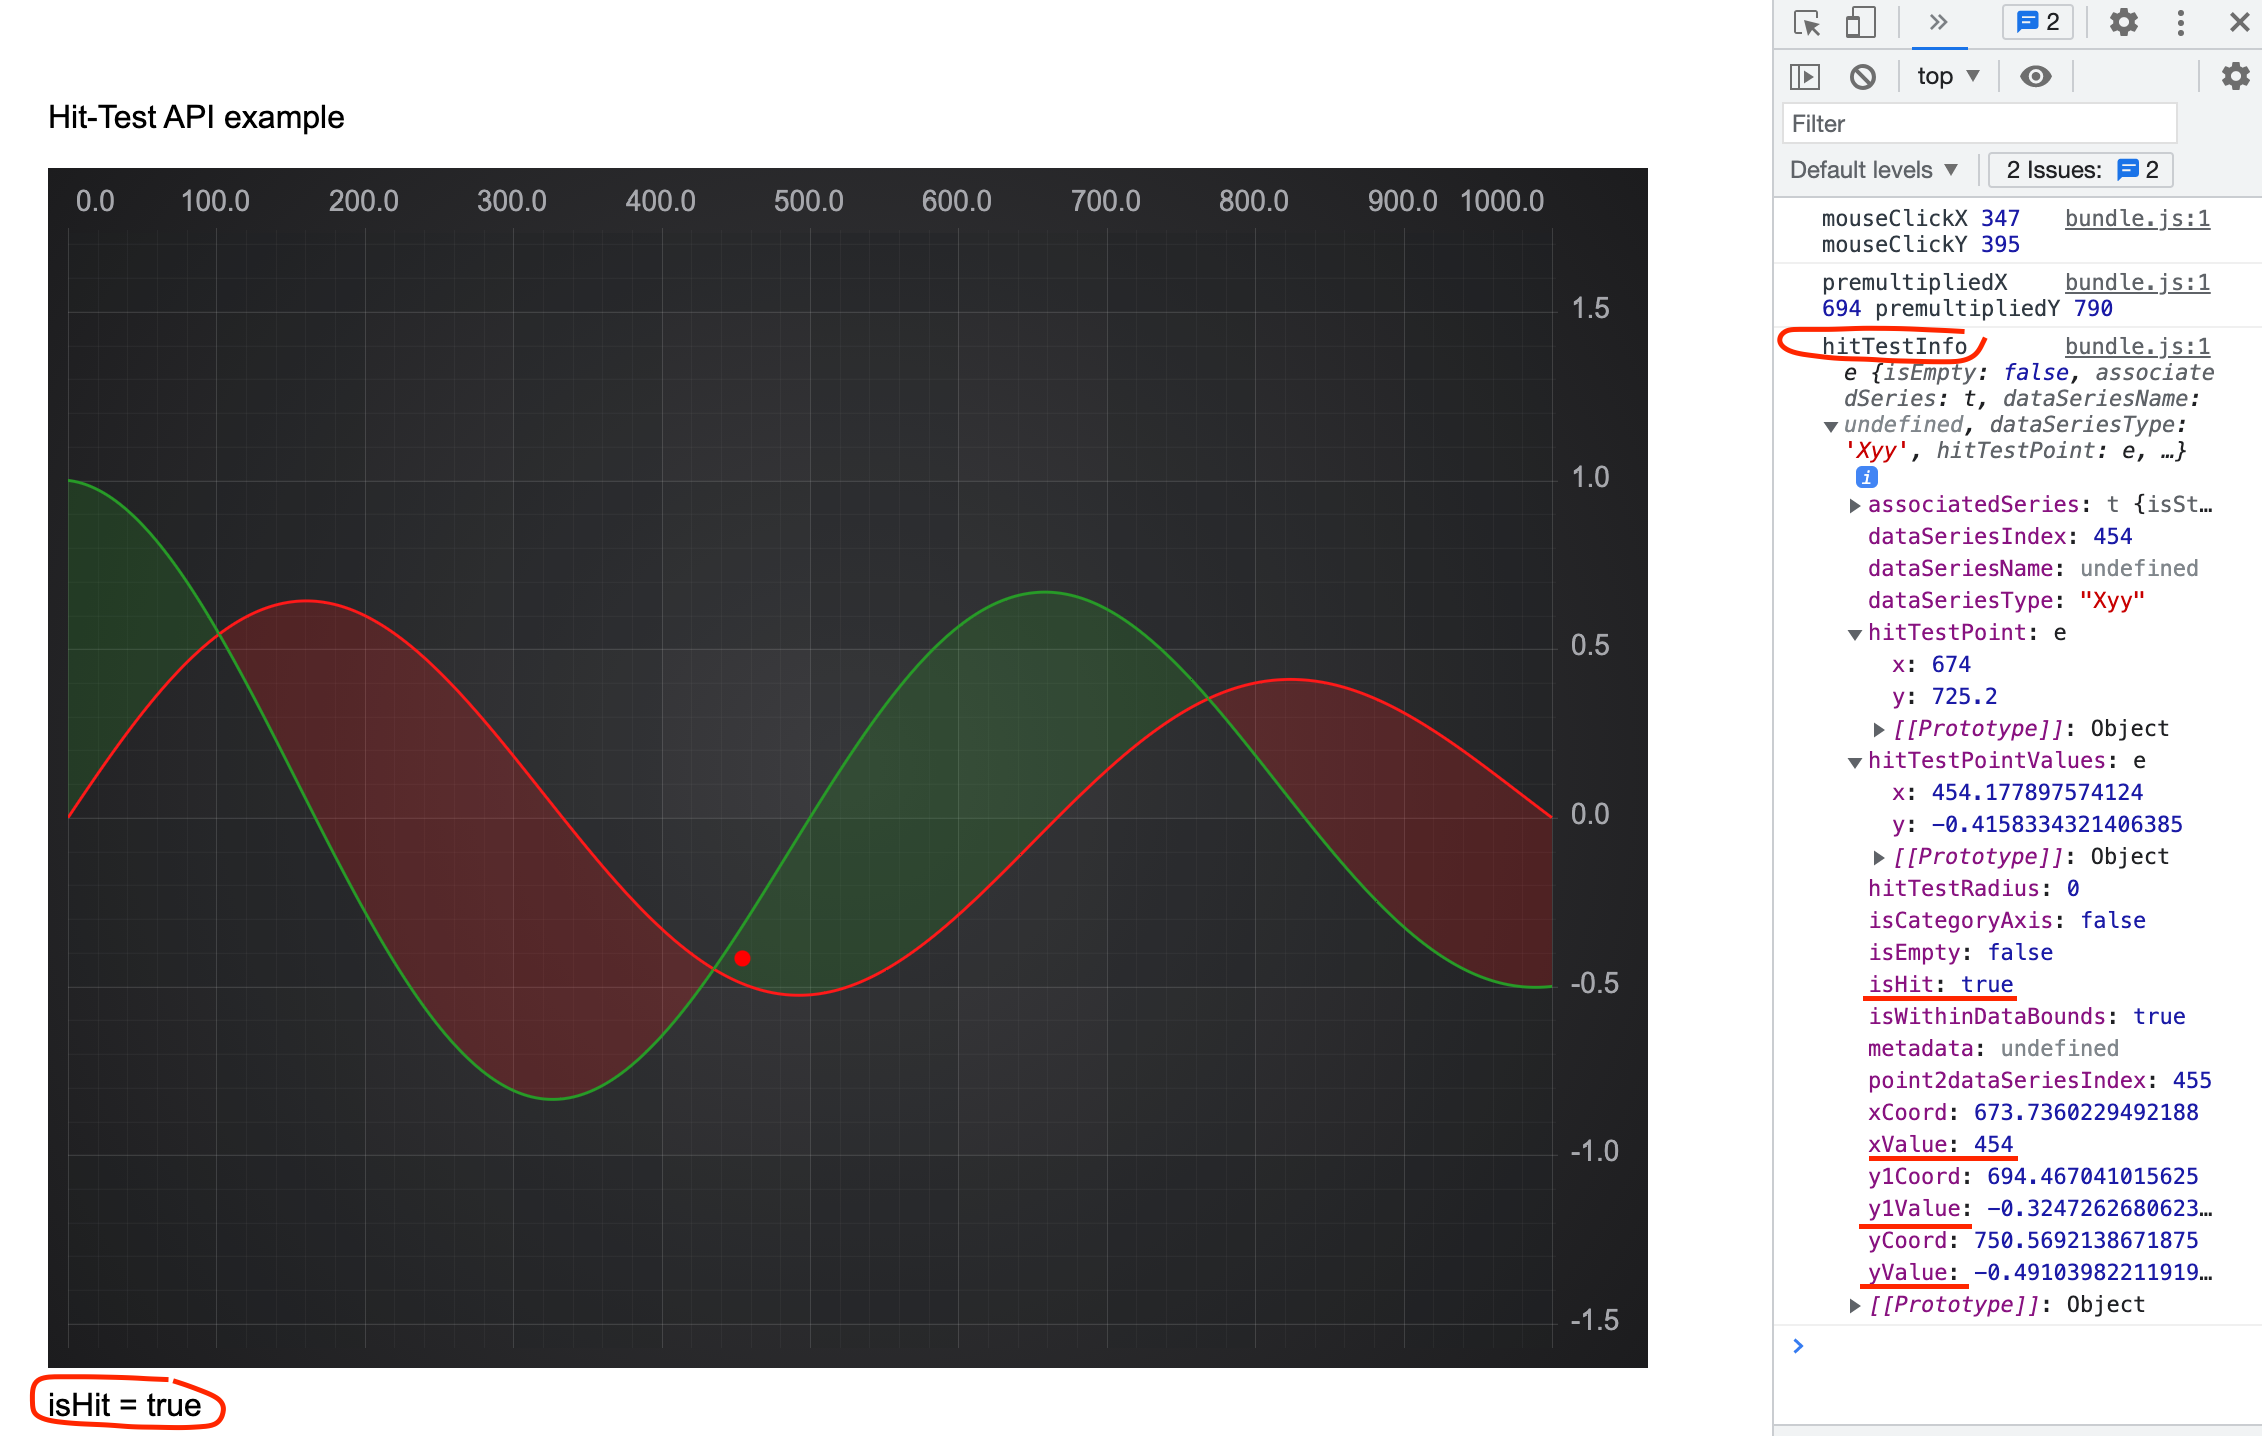
If we click inside the band it will be hit. In the browser console you will find output for the HitTestInfo object containing y1Value and y1Coord properties specific for the series.
The hitTestDataPoint method on Band Series
The IHitTestProvider.hitTestDataPoint method on FastBandRenderableSeries tests if the click was within the hitTestRadius from XY or XY1 data point.
hitTestDataPoint method on Band Series
const hitTestInfo = bandSeries.hitTestProvider.hitTestDataPoint(premultipliedX, premultipliedY, HIT_TEST_RADIUS);
The algorithm is as follows:
- Iterate over each of XY and XY1 points to find the nearest one on the plane.
- Compare distance to XY and XY1 points with the hitTestRadius and update HitTestInfo.isHit property accordingly.
The hitTestXSlice method on Band Series
The IHitTestProvider.hitTestXSlice method is used for CursorModifier and RolloverModifier to get information about the nearest point.
hitTestXSlice method on Band Series
const hitTestInfo = bandSeries.hitTestProvider.hitTestXSlice(premultipliedX, premultipliedY);
The way it works:
- Finds the nearest point in X direction.
- Sets HitTestInfo.isHit property to True if the mouse click was within the data bounds.