Per-point Colouring for Line Series
Line series can be colored per-point or per line-segment using the PaletteProvider API. To use this, we must create a class (typescript) or object (javascript) which implements or confirms to the IStrokePaletteProvider📘 interface. Then, apply this to the FastLineRenderableSeries.paletteProvider📘 property.
Let's start off with the PaletteProvider class:
- TS
const { DefaultPaletteProvider, EStrokePaletteMode, parseColorToUIntArgb } = SciChart;

// or, for npm, import { DefaultPaletteProvider, ... } from "scichart"

// Custom PaletteProvider for line series which colours datapoints above a threshold
class ThresholdLinePaletteProvider extends DefaultPaletteProvider {
    rule: any;
    stroke: number;
    constructor(stroke, rule) {
        super();
        this.strokePaletteMode = EStrokePaletteMode.SOLID;
        this.rule = rule;
        this.stroke = parseColorToUIntArgb(stroke);
    }

    // This function is called for every data-point.
    // Return undefined to use the default color for the line,
    // else, return a custom colour as an ARGB color code, e.g. 0xFFFF0000 is red
    overrideStrokeArgb(xValue, yValue, index, opacity, metadata) {
        return this.rule(yValue) ? this.stroke : undefined;
    }
}
Next, we can apply the PaletteProvider to the line series. This can be done both with the programmatic API and the Builder API:
- TS
- Builder API (JSON Config)
// Demonstrates how to create a line chart with PaletteProvider using SciChart.js
const { SciChartSurface, NumericAxis, FastLineRenderableSeries, XyDataSeries, SciChartJsNavyTheme } = SciChart;

// or, for npm, import { SciChartSurface, ... } from "scichart"

const { wasmContext, sciChartSurface } = await SciChartSurface.create(divElementId, {
    theme: new SciChartJsNavyTheme()
});
sciChartSurface.xAxes.add(new NumericAxis(wasmContext));
sciChartSurface.yAxes.add(new NumericAxis(wasmContext));

const xValues = [];
const yValues = [];
for (let i = 0; i < 100; i++) {
    xValues.push(i);
    yValues.push(0.2 * Math.sin(i * 0.1) - Math.cos(i * 0.01));
}

const xyDataSeries = new XyDataSeries(wasmContext, {
    xValues,
    yValues
});

// The ThresholdLinePaletteProvider we created before is applied to a FastLineRenderableSeries
const lineSeries = new FastLineRenderableSeries(wasmContext, {
    stroke: "#F48420",
    strokeThickness: 5,
    dataSeries: xyDataSeries,
    paletteProvider: new ThresholdLinePaletteProvider("#30BC9A", yValue => yValue > -0.8)
});

sciChartSurface.renderableSeries.add(lineSeries);
// Demonstrates how to create a chart with a custom PaletteProvider, using the builder API
const { chartBuilder, EBaseType, ESeriesType, EPaletteProviderType, EThemeProviderType } = SciChart;

// or, for npm, import { chartBuilder, ... } from "scichart"

// Register the custom ThresholdLinePaletteProvider with the chartBuilder
chartBuilder.registerType(
    EBaseType.PaletteProvider,
    "ThresholdLinePaletteProvider",
    options => new ThresholdLinePaletteProvider(options.stroke, options.rule)
);

// Now use the Builder-API to build the chart
const { wasmContext, sciChartSurface } = await chartBuilder.build2DChart(divElementId, {
    surface: { theme: { type: EThemeProviderType.Dark } },
    series: [
        {
            type: ESeriesType.LineSeries,
            xyData: {
                xValues: [0, 1, 2, 3, 4, 5, 6, 7, 8, 9],
                yValues: [2.5, 3.5, 3.7, 3.99, 4.0, 5.0, 5.5, 5.0, 4.0, 3.0]
            },
            options: {
                stroke: "#FF6600",
                strokeThickness: 5,
                // Now you can instantiate using parameters below
                paletteProvider: {
                    type: EPaletteProviderType.Custom,
                    customType: "ThresholdLinePaletteProvider",
                    options: {
                        stroke: "Green",
                        rule: yValue => yValue >= 4.0
                    }
                }
                // Note: Assigning an instance is also valid, e.g.
                // paletteProvider: new ThresholdLinePaletteProvider("Green", yValue => yValue >= 4.0)
            }
        }
    ]
});
This results in the following output:
In TypeScript you only need to implement an interface such as IStrokePaletteProvider📘, whereas in JavaScript you must extend the DefaultPaletteProvider📘 class.
Gradient Transitions in Lines
Change strokePaletteMode📘 to EStrokePaletteMode.GRADIENT📘 to get a gradient color transition:
- JS
- TS
class LinePaletteProvider extends DefaultPaletteProvider {
    constructor(stroke, rule) {
        super();
        this.strokePaletteMode = EStrokePaletteMode.GRADIENT;
        // ..
    }
    // ..
}
class LinePaletteProvider implements IStrokePaletteProvider {
    readonly strokePaletteMode: EStrokePaletteMode = EStrokePaletteMode.GRADIENT;
    // ...
}
This now results in gradient color changes between line segments.
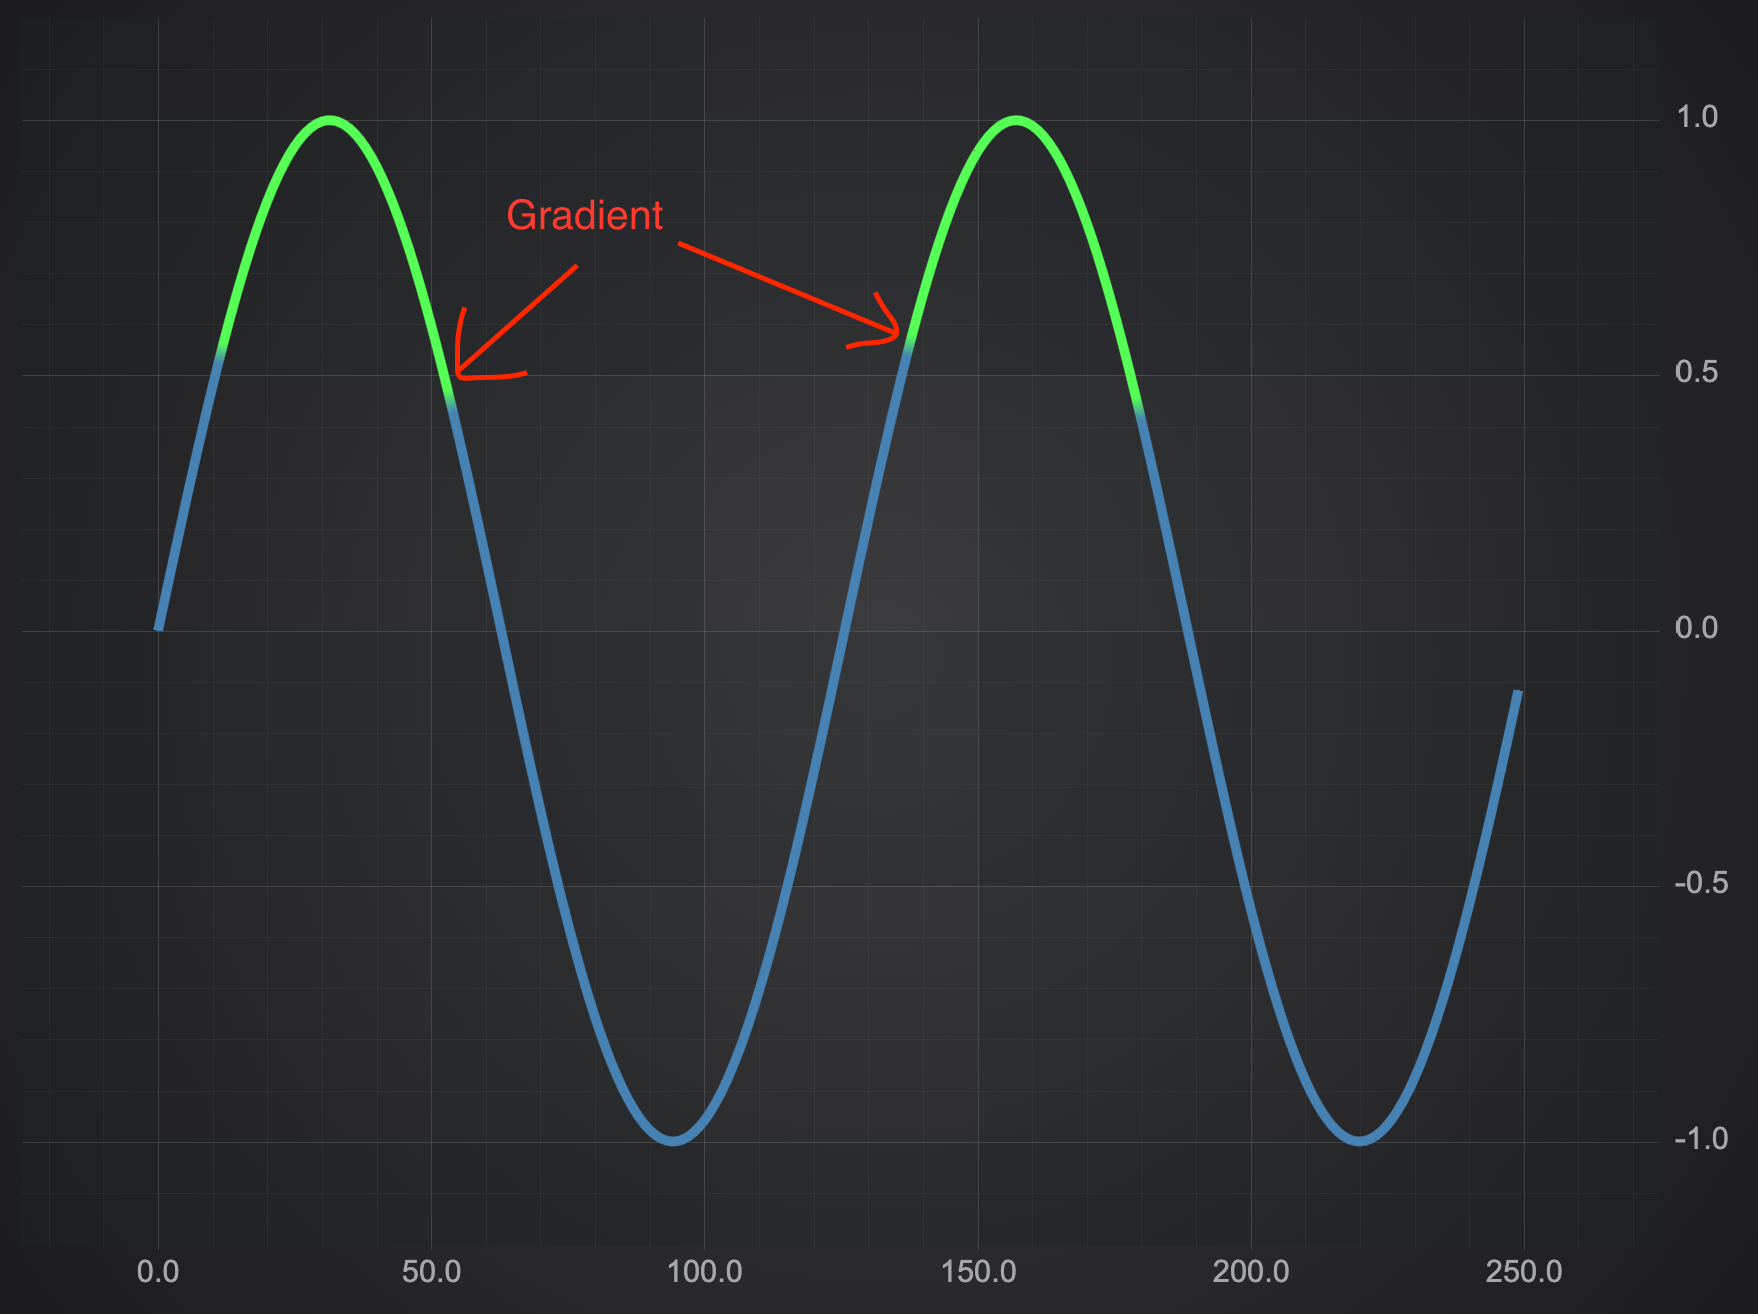
Note: SciChart won't bisect the line at a threshold value but only changes colour between line segments in the data you already have. If you want to have a perfect transistion from one colour to another at a specific Y-value, you will need to include data-points