Tutorial 03 - Adding Zooming, Panning Behavior
In the previous tutorial we explained how to add a line series with some data to a JavaScript Chart using SciChart.js. In this tutorial, we are going to show you how to add zooming and panning behaviour to the chart.
The source code for this tutorial can be found at SciChart.Js.Examples Github Repository
Adding Zooming and Panning
So far in the tutorial series, we have created a new chart, added an XAxis and YAxis, added some data series, and simple zoom modifiers. Now are going to extend that and add more interaction behavior with ChartModifiers.
ChartModifiers
In SciChart, chart interactions are defined by ChartModifiers. In addition to the SciChart modifiers you can write custom modifiers or extends existing ones.
The provided modifiers include RubberBandXyZoomModifier, ZoomPanModifier, ZoomExtentsModifier, MouseWheelZoomModifier and more.
Adding Chart Modifiers
Now we are going to create and configure a couple of new modifiers and add them to the SciChartSurface.chartModifiers📘 collection:
- JS
  import {
      SciChartSurface,
      NumericAxis,
      XyDataSeries,
      FastLineRenderableSeries,
      MouseWheelZoomModifier,
      RubberBandXyZoomModifier,
      ZoomPanModifier,
      ZoomExtentsModifier,
      EExecuteOn,
      EModifierMouseArgKey
  } from "scichart";

  async function initSciChart() {
      // Create the SciChartSurface in the div 'scichart-root'
      // The SciChartSurface, and webassembly context 'wasmContext' are paired. This wasmContext
      // instance must be passed to other types that exist on the same surface.
      const {sciChartSurface, wasmContext} = await SciChartSurface.create("scichart-root");

      // Create an X,Y Axis and add to the chart
      sciChartSurface.xAxes.add(new NumericAxis(wasmContext));
      sciChartSurface.yAxes.add(new NumericAxis(wasmContext));

      // Create 100 dataseries, each with 10k points
      for (let seriesCount = 0; seriesCount < 100; seriesCount++) {
          const xyDataSeries = new XyDataSeries(wasmContext);

          const opacity = (1 - ((seriesCount / 120))).toFixed(2);

          // Populate with some data
          for(let i = 0; i < 10000; i++) {
              xyDataSeries.append(i, Math.sin(i* 0.01) * Math.exp(i*(0.00001*(seriesCount+1))));
          }

          // Add and create a line series with this data to the chart
          sciChartSurface.renderableSeries.add(new FastLineRenderableSeries(wasmContext, {
              dataSeries: xyDataSeries,
              stroke: `rgba(176,196,222,${opacity})`,
              strokeThickness:2
          }));
      }

      const mouseWheelZoomModifier = new MouseWheelZoomModifier();
      // For zoomPanModifier we change execute condition not to conflict with rubberBandZoomModifier
      const zoomPanModifier = new ZoomPanModifier({
          executeCondition: { button: EExecuteOn.MouseRightButton, key: EModifierMouseArgKey.None }
      });
      const rubberBandZoomModifier = new RubberBandXyZoomModifier();
      const zoomExtentsModifier = new ZoomExtentsModifier();

      // Adds zoom, pan behaviours to the chart
      // Mousewheel zoom, panning and double-click to zoom to fit

      sciChartSurface.chartModifiers.add(zoomExtentsModifier);
      sciChartSurface.chartModifiers.add(zoomPanModifier);
      sciChartSurface.chartModifiers.add(rubberBandZoomModifier);
      sciChartSurface.chartModifiers.add(mouseWheelZoomModifier);
  }

  initSciChart();
Dont' forget the HTML must have a div with id="scichart-root" to display the chart.
- HTML
<html lang="en-us">
<head>
<meta charset="utf-8" />
<meta content="text/html; charset=utf-8" http-equiv="Content-Type" />
<link rel="icon" href="data:," />
<title>SciChart.js Tutorial 3</title>
<script async type="text/javascript" src="bundle.js"></script>
<style>
body { font-family: 'Arial'}
</style>
</head>
<body>
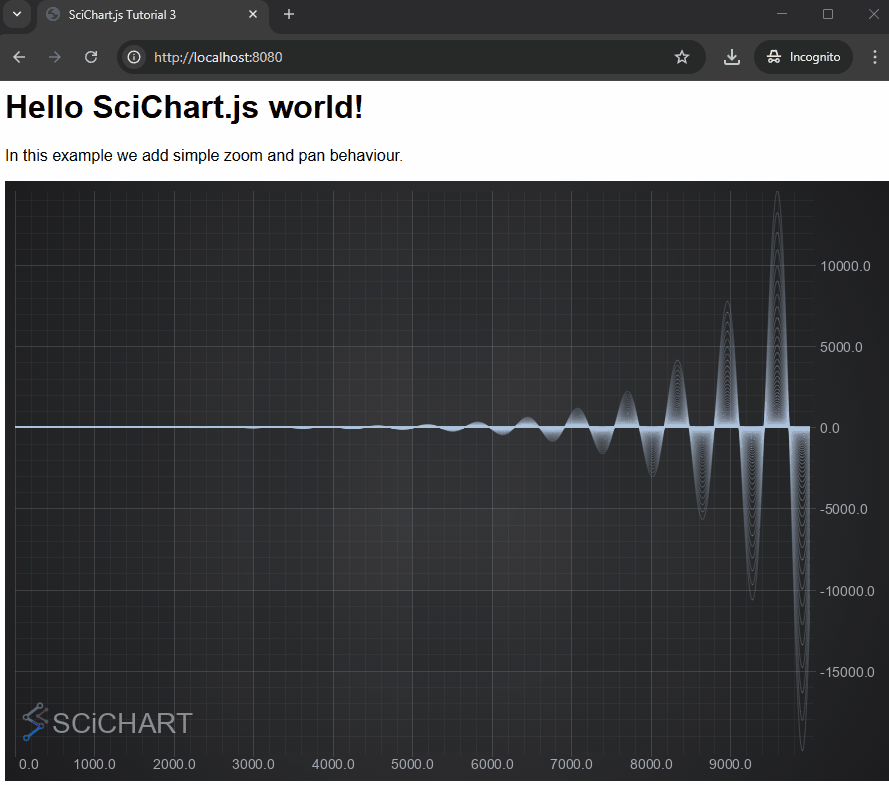
<h1>Hello SciChart.js world!</h1>
<p>In this example we add simple zoom and pan behaviour.</p>
<!-- the Div where the SciChartSurface will reside -->
<div id="scichart-root" style="height: 600px; width: 100%;"></div>
</body>
</html>
After re-building and running the application the chart should behave like this:
You can use ChartModifierBase.executeCondition📘 to make it work with different mouse button or mouse button + Ctrl/Alt/Shift button. Like we did in the example above
const zoomPanModifier = new ZoomPanModifier({
    executeCondition: { button: EExecuteOn.MouseRightButton, key: EModifierMouseArgKey.None }
});
Enabling and Disabling ChartModifiers
Some ChartModifiers conflict, as they need the same mouse-button to execute. If you wanted to add RubberBandXyZoomModifier to a chart, but also wanted to pan on mouse-drag, you can use the ZoomPanModifier, but you will need to enable/disable it so that only one of these is active at one time.
Let's extend the application to add panning behaviour, and also allow switching active modifiers.
- HTML
<html lang="en-us">
<head>
<meta charset="utf-8" />
<meta content="text/html; charset=utf-8" http-equiv="Content-Type" />
<link rel="icon" href="data:," />
<title>SciChart.js Tutorial 3</title>
<script async type="text/javascript" src="bundle.js"></script>
<style>
body { font-family: 'Arial' }
</style>
</head>
<body>
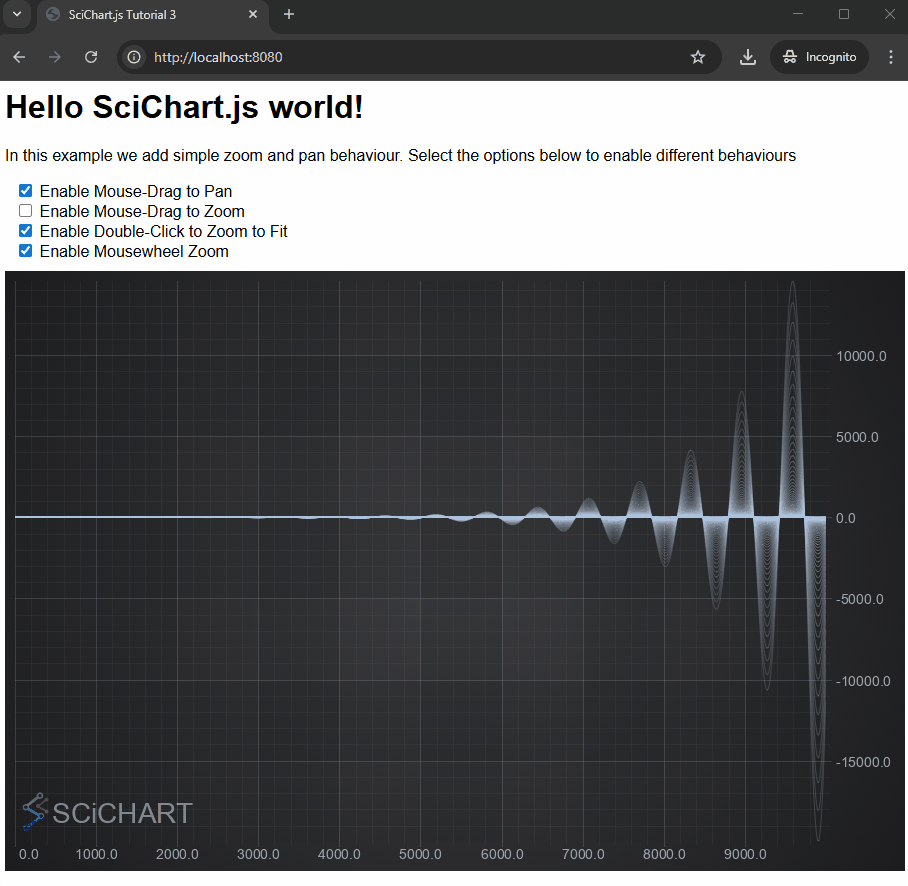
<h1>Hello SciChart.js world!</h1>
<p>In this example we add simple zoom and pan behaviour. Select the options below to enable different behaviours</p>
<div style="margin: 10px;">
<input type="checkbox" id="enable-pan" checked>
<label for="enable-pan">Enable Mouse-Drag to Pan</label><br>
<input type="checkbox" id="enable-zoom">
<label for="enable-zoom">Enable Mouse-Drag to Zoom</label><br>
<input type="checkbox" id="enable-zoom-to-fit" checked>
<label for="enable-zoom-to-fit">Enable Double-Click to Zoom to Fit</label><br>
<input type="checkbox" id="enable-mouse-wheel-zoom" checked>
<label for="enable-mouse-wheel-zoom">Enable Mousewheel Zoom</label><br>
</div>
<!-- the Div where the SciChartSurface will reside -->
<div id="scichart-root" style="height: 600px; width: 100%;"></div>
</body>
</html>
Modify the HTML of the page to add some checkboxes. These will be used to enable and disable chart modifiers in index.js.
Next, add the following code to index.js. We could use React or Angular to handle these events, but for now lets just use Vanilla Javascript so we can show how easy it is to enable/disable ChartModifiers in SciChart.js.
- JS
  import {
      SciChartSurface,
      NumericAxis,
      XyDataSeries,
      FastLineRenderableSeries,
      MouseWheelZoomModifier,
      RubberBandXyZoomModifier,
      ZoomPanModifier,
      ZoomExtentsModifier
  } from "scichart";

  async function initSciChart() {
      // Create the SciChartSurface in the div 'scichart-root'
      // The SciChartSurface, and webassembly context 'wasmContext' are paired. This wasmContext
      // instance must be passed to other types that exist on the same surface.
      const {sciChartSurface, wasmContext} = await SciChartSurface.create("scichart-root");

      // Create an X,Y Axis and add to the chart
      sciChartSurface.xAxes.add(new NumericAxis(wasmContext));
      sciChartSurface.yAxes.add(new NumericAxis(wasmContext));

      // Create 100 dataseries, each with 10k points
      for (let seriesCount = 0; seriesCount < 100; seriesCount++) {
          const xyDataSeries = new XyDataSeries(wasmContext);

          const opacity = (1 - ((seriesCount / 120))).toFixed(2);

          // Populate with some data
          for(let i = 0; i < 10000; i++) {
              xyDataSeries.append(i, Math.sin(i* 0.01) * Math.exp(i*(0.00001*(seriesCount+1))));
          }

          // Add and create a line series with this data to the chart
          sciChartSurface.renderableSeries.add(new FastLineRenderableSeries(wasmContext, {
              dataSeries: xyDataSeries,
              stroke: `rgba(176,196,222,${opacity})`,
              strokeThickness:2
          }));
      }

      const mouseWheelZoomModifier = new MouseWheelZoomModifier();
      const zoomPanModifier = new ZoomPanModifier();
      const rubberBandZoomModifier = new RubberBandXyZoomModifier();
      // We disable rubberBandZoomModifier not to conflict with zoomPanModifier
      rubberBandZoomModifier.isEnabled = false;
      const zoomExtentsModifier = new ZoomExtentsModifier();

      // Adds zoom, pan behaviours to the chart
      // Mousewheel zoom, panning and double-click to zoom to fit

      sciChartSurface.chartModifiers.add(zoomExtentsModifier);
      sciChartSurface.chartModifiers.add(zoomPanModifier);
      sciChartSurface.chartModifiers.add(rubberBandZoomModifier);
      sciChartSurface.chartModifiers.add(mouseWheelZoomModifier);

      const inputEnablePan = document.getElementById("enable-pan");
      const inputEnableZoom = document.getElementById("enable-zoom");
      const inputEnableZoomToFit = document.getElementById("enable-zoom-to-fit");
      const inputEnableMouseWheel = document.getElementById("enable-mouse-wheel-zoom");

      inputEnablePan.addEventListener("input", (event) => {
          zoomPanModifier.isEnabled = inputEnablePan.checked;
          rubberBandZoomModifier.isEnabled = !inputEnablePan.checked;
          inputEnableZoom.checked = !inputEnablePan.checked;
          console.log(`Enabling Drag to Pan. Status: rubberBand checkbox ${inputEnableZoom.checked}, rubberBand ${rubberBandZoomModifier.isEnabled}, zoomPan checkbox ${inputEnablePan.isEnabled}, zoomPan ${zoomPanModifier.isEnabled} `);
      });

      inputEnableZoom.addEventListener("input", (event) => {
          rubberBandZoomModifier.isEnabled = inputEnableZoom.checked;
          zoomPanModifier.isEnabled = !inputEnableZoom.checked;
          inputEnablePan.checked = !inputEnableZoom.checked;
          console.log(`Enabling Drag to Zoom. Status: rubberBand checkbox ${inputEnableZoom.checked}, rubberBand ${rubberBandZoomModifier.isEnabled}, zoomPan checkbox ${inputEnablePan.isEnabled}, zoomPan ${zoomPanModifier.isEnabled} `);
      });

      inputEnableZoomToFit.addEventListener("input", (event) => {
          zoomExtentsModifier.isEnabled = inputEnableZoomToFit.checked;
          console.log("Enabling zoom extents");
      });

      inputEnableMouseWheel.addEventListener("input", (event) => {
          mouseWheelZoomModifier.isEnabled = inputEnableMouseWheel.checked;
          console.log("Enabling Mousewheel zoom");
      });
  }

  initSciChart();
Enabling or disabling a ChartModifier is as easy as setting the ChartModifierBase.isEnabled📘 property. You could have a keyboard shortcut to switch from pan to zoom behaviour for example, or a toolbar button to create the desired behaviour.
A Note on Licensing SciChart.
The SciChart.js control comes with a community license which is watermarked. This can be used for commercial trial use for a reasonable time period.
For commercial licenses, a license key can be applied following the instructions at www.scichart.com/licensing-scichart-js.