Tutorial 06 - Adding Annotations
In Tutorial 5 - Zoom and Pan with Realtime Updates, we showed you how to do zooming and panning having realtime updates. In this tutorial, were going to show you how to add annotations.
The annotation API allows you to add other UI elements, markers or labels to a chart, like Lines, Text, Boxes, SVG elements and more.
Source code for this tutorial can be found at SciChart.JS.Examples Github Repository.
Chart Annotations in SciChart
The SciChart annotations derive from the IAnnotation📘 interface.
The annotation types included with SciChart.js out of the box are: LineAnnotation, BoxAnnotation, TextAnnotation, VerticalLineAnnotation, HorizontalLineAnnotation, AxisMarkerAnnotation, NativeTextAnnotation and other.
It's also possible to add custom shapes and markers to the chart using CustomAnnotation.
The full list of supported annotations can be found on the Annotations API Overview page.
Adding Annotations to the Chart
In this tutorial we will create a simple example showing how to add different annotation types to a chart.
First we create a SciChartSurface📘, then we add X and Y Axes as normal, and finally we add a LineAnnotation by adding an instance to the SciChartSurface.annotations📘 collection.
The code is shown below:
- Part1/index.js
import { SciChartSurface, NumericAxis, LineAnnotation } from "scichart";

async function initSciChart() {
    // Create the SciChartSurface in the div 'scichart-root'
    // The SciChartSurface, and webassembly context 'wasmContext' are paired. This wasmContext
    // instance must be passed to other types that exist on the same surface.
    const { sciChartSurface, wasmContext } = await SciChartSurface.create(
        "scichart-root"
    );

    // Create an X,Y Axis and add to the chart
    sciChartSurface.xAxes.add(new NumericAxis(wasmContext));
    sciChartSurface.yAxes.add(new NumericAxis(wasmContext));

    // Add line annotation
    sciChartSurface.annotations.add(
        new LineAnnotation({
        stroke: "#FF6600",
        strokeThickness: 3,
        x1: 1.0,
        x2: 4.0,
        y1: 6.0,
        y2: 9.0,
        })
    );
}

initSciChart();
This code produces this following chart with an X,Y axis and a single LineAnnotation.

In order to add other annotation types to the chart pass appropriate annotation to sciChartSurface.annotations.add()📘. In the code below we add LineAnnotation and BoxAnnotation to the chart.
- Part2/index.js region A
// Add line annotation
sciChartSurface.annotations.add(
    new LineAnnotation({
    stroke: "#FF6600",
    strokeThickness: 3,
    x1: 1.0,
    x2: 4.0,
    y1: 6.0,
    y2: 9.0,
    })
);

// Add box annotation
sciChartSurface.annotations.add(
    new BoxAnnotation({
    stroke: "#33FF33",
    strokeThickness: 1,
    fill: "rgba(50, 255, 50, 0.3)",
    x1: 6.0,
    x2: 9.0,
    y1: 6.0,
    y2: 9.0,
    })
);
Let's also try to add a TextAnnotation.
Note that this annotation type only requires x1,y1, whereas LineAnnotation and BoxAnnotation require x1,x2,y1,y2 to define their bounds.
Instead the TextAnnotation is placed at a single x,y point, and the location of that point is defined by the horizontalAnchorPoint📘 and verticalAnchorPoint📘 properties.
- Part2/index.js region B
// Add text annotation
sciChartSurface.annotations.add(
    new TextAnnotation({
    x1: 0.25,
    y1: 0.75,
    xCoordinateMode: ECoordinateMode.Relative,
    yCoordinateMode: ECoordinateMode.Relative,
    horizontalAnchorPoint: EHorizontalAnchorPoint.Center,
    verticalAnchorPoint: EVerticalAnchorPoint.Center,
    textColor: "yellow",
    fontSize: 26,
    fontFamily: "Comic Sans MS",
    text: "TEXT ANNOTATION",
    })
);
The next annotation type we're going to add is a CustomAnnotation.
This allows you to create custom SVG markers and add them to the chart. CustomAnnotations require only x1,y1 properties and obey horizontalAnchorPoint📘 and verticalAnchorPoint📘 properties like TextAnnotations do.
- Part2/index.js region C
// Add custom SVG annotation
const svgString = `
<svg baseProfile="full" width="200" height="200" xmlns="http://www.w3.org/2000/svg">
    <circle cx="100" cy="100" r="100" fill="rgba(50,50,255,0.3)" />
    <text x="100" y="125" font-size="60" text-anchor="middle" fill="white">SVG</text>
</svg>`;
sciChartSurface.annotations.add(
    new CustomAnnotation({
    x1: 7.5,
    y1: 2.5,
    horizontalAnchorPoint: EHorizontalAnchorPoint.Center,
    verticalAnchorPoint: EVerticalAnchorPoint.Center,
    svgString,
    })
);
This results in a chart with four different annotation.

Further APIs
Annotations support the ability to be docked to the left/right/top/bottom of the chart viewport. You can adjust the docking using the xCoordinateMode📘 / yCoordinateMode📘 properties.
Some annotations support verticalAnchorPoint📘 / horizontalAnchorPoint📘 properties. These allow you to change the control point for annotations which have a single X,Y point.
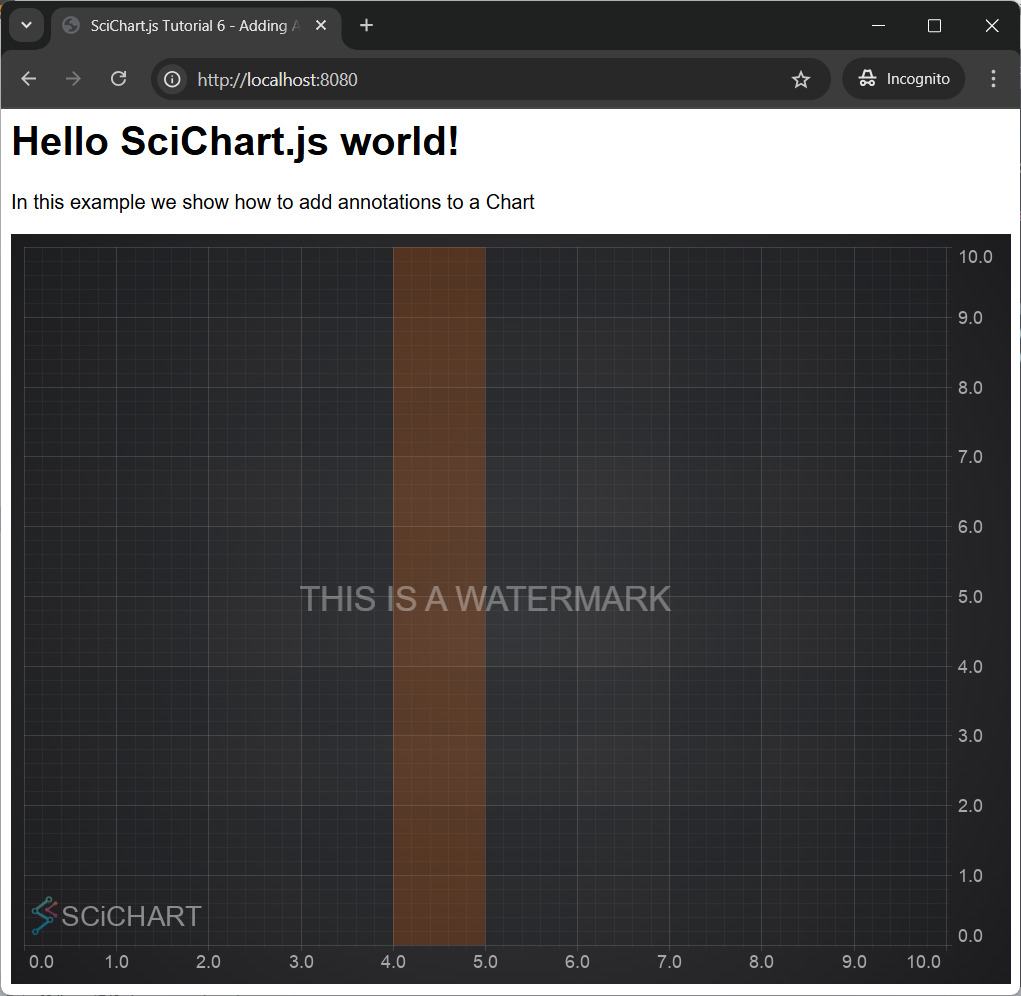
A combination of anchor points and coordinate modes can allow you to create text watermarks on charts, or boxes which stretch horizontally or vertically over a chart.
For example:
- Part2/index.js region D
// Add a watermark centered on the chart
sciChartSurface.annotations.add(
    new TextAnnotation({
    x1: 0.5,
    y1: 0.5,
    xCoordinateMode: ECoordinateMode.Relative,
    yCoordinateMode: ECoordinateMode.Relative,
    horizontalAnchorPoint: EHorizontalAnchorPoint.Center,
    verticalAnchorPoint: EVerticalAnchorPoint.Center,
    text: "THIS IS A WATERMARK",
    opacity: 0.33,
    fontSize: 27,
    })
);

// Add a box vertically stretched between data-points X=4, X=5
sciChartSurface.annotations.add(
    new BoxAnnotation({
    x1: 4,
    x2: 5,
    // y:0-1 Relative means stretch vertically
    y1: 0,
    y2: 1,
    yCoordinateMode: ECoordinateMode.Relative,
    strokeThickness: 0,
    fill: "#ff660033",
    })
);
View our Annotations Demos online
You can find out more about the Annotations API in the relevant section of the documentation: The Annotations API Overview.
Also, there is a couple of examples showcasing annotations in our Examples Suite. See the JavaScript Chart Annotations example for more details.
In this example we show how to create multiple annotation types, including liners, text, watermarks, stretched boxes, images, vectors (SVG) and horizontal/vertical lines.
The full source code for the Annotations demo can be found below, as well as on Github.