Tutorial 07 - Adding Tooltips and Legends
In the previous tutorial we explained how to add annotations to a JavaScript Chart using SciChart.js. In this tutorial, we are going to show you how to add tooltips and legends.
Source code for this tutorial can be found at SciChart.JS.Examples Github Repository
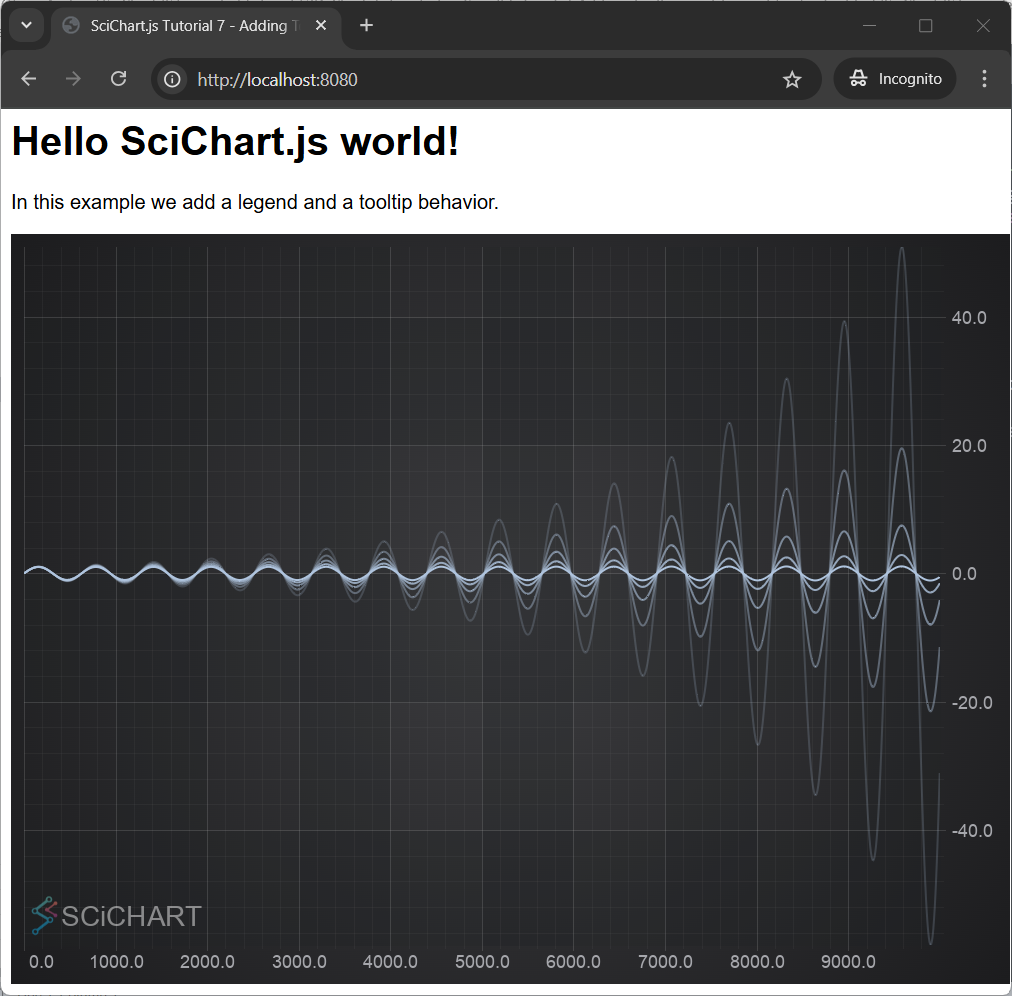
Lets create a simple chart with 5 dataseries each having 10k points.
- index.js region A
- index.html
import {
  SciChartSurface,
  NumericAxis,
  XyDataSeries,
  FastLineRenderableSeries,
  RolloverModifier,
  LegendModifier,
  CursorModifier,
} from "scichart";

async function initSciChart() {
  // #region ExampleA
  // Create the SciChartSurface in the div 'scichart-root'
  // The SciChartSurface, and webassembly context 'wasmContext' are paired. This wasmContext
  // instance must be passed to other types that exist on the same surface.
  const { sciChartSurface, wasmContext } = await SciChartSurface.create(
    "scichart-root"
  );

  // Create an X,Y Axis and add to the chart
  sciChartSurface.xAxes.add(new NumericAxis(wasmContext));
  sciChartSurface.yAxes.add(new NumericAxis(wasmContext));

  // Create 5 dataseries, each with 10k points
  for (let seriesCount = 0; seriesCount < 5; seriesCount++) {
    const xyDataSeries = new XyDataSeries(wasmContext);

    const opacity = (1 - seriesCount / 5).toFixed(2);

    // Populate with some data
    for (let i = 0; i < 10000; i++) {
      xyDataSeries.append(
        i,
        Math.sin(i * 0.01) * Math.exp(i * (0.00001 * (seriesCount * 10 + 1)))
      );
    }

    // Add and create a line series with this data to the chart
    // Create a line series
    const lineSeries = new FastLineRenderableSeries(wasmContext, {
      dataSeries: xyDataSeries,
      stroke: `rgba(176,196,222,${opacity})`,
      strokeThickness: 2,
    });
    sciChartSurface.renderableSeries.add(lineSeries);
  }
  // #endregion
}

initSciChart();
<html lang="en-us">
    <head>
        <meta charset="utf-8" />
        <meta content="text/html; charset=utf-8" http-equiv="Content-Type" />
        <title>SciChart.js Tutorial 7 - Adding Tooltips and Legends</title>
        <script async type="text/javascript" src="bundle.js"></script>
        <style>
            body { font-family: 'Arial'}
        </style>
    </head>
    <body>
        <h1>Hello SciChart.js world!</h1>
        <p>In this example we add a legend and a tooltip behavior.</p>

        <!-- the Div where the SciChartSurface will reside -->
        <div id="scichart-root" style="width: 800px; height: 600px;"></div>
    </body>
</html>
So far we have created a new chart, added both X axis and Y axis and plotted 5 data series.
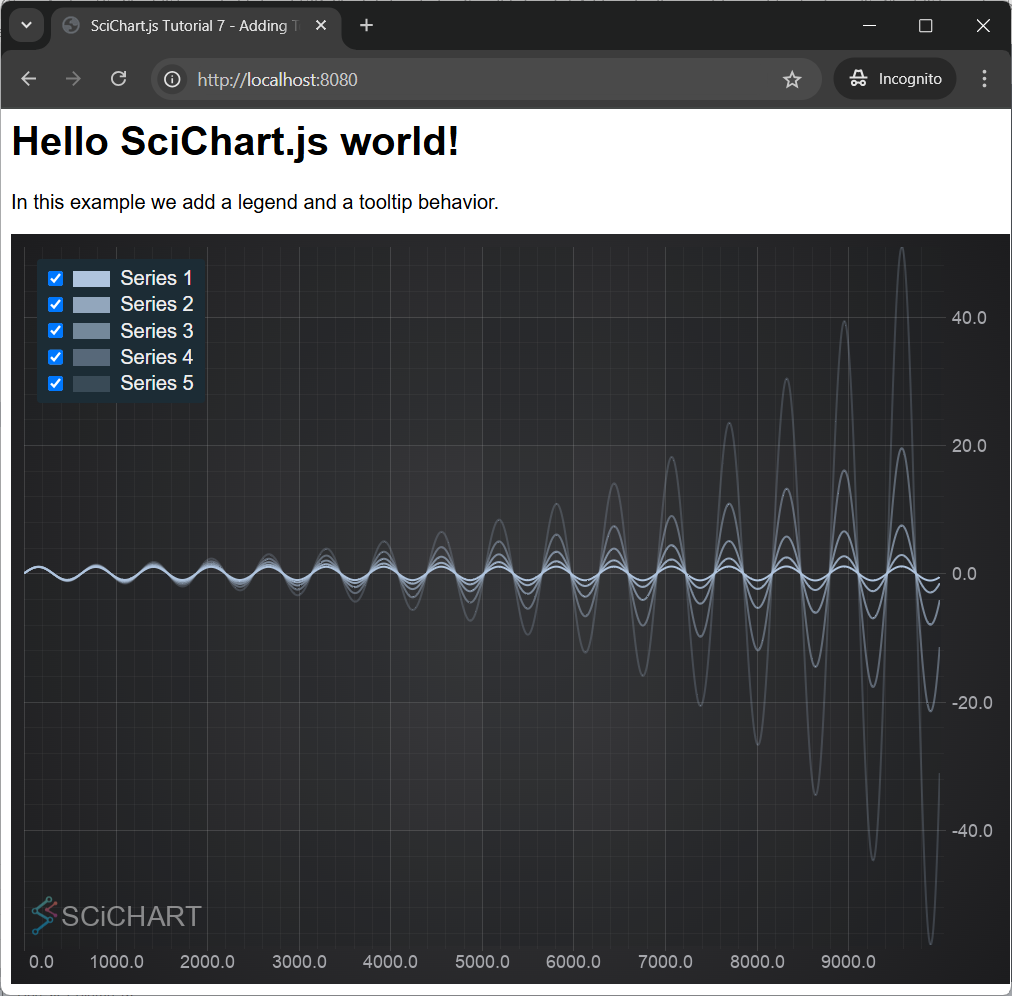
Add a Legend
Now we will add a chart legend. In SciChart, a chart legend can be created and configured via the LegendModifier:
- index.js region B
  // Add a Legend
  sciChartSurface.chartModifiers.add(
    new LegendModifier({ showCheckboxes: true })
  );
This gives us the Legend, which displays checkboxes to show/hide the series, series markers and series names.
Add a Cursor (Crosshair)
CursorModifier adds a crosshair onto a SciChartSurface. When you place the cursor over the SciChartSurface, it shows X and Y values of the current point in tooltips over the Axes.
- index.js region C
  // Add axis label tooltips using CursorModifier
  const cursorModifier = new CursorModifier({
    axisLabelFill: "black",
    axisLabelStroke: "#00FF00",
    showAxisLabels: true,
    showTooltip: false,
    showXLine: true,
    showYLine: true,
  });
  sciChartSurface.chartModifiers.add(cursorModifier);
It gives us the result:

To learn more about the CursorModifier, how to add configurable tooltips and how to show/hide or style parts like the crosshair, axis labels, see the CursorModifier documentation.
Add a RolloverModifier Tooltip
Tooltips may be added to the SciChartSurface using the RolloverModifier. This is a ChartModifierBase📘 derived type which is attached to the SciChartSurface.chartModifiers📘 property.
Remove the previous CursorModifier from the chart. Now add a RolloverModifier by add this code:
- index.js region D
  // Add a tooltip behavior using the RolloverModifier
  const tooltipModifier = new RolloverModifier({
    showTooltip: true,
    showAxisLabel: true,
    showRolloverLine: true,
    isEnabled: false,
    rolloverLineStroke: "#FF6600",
    rolloverLineStrokeThickness: 2,
  });
  sciChartSurface.chartModifiers.add(tooltipModifier);
That gives us the chart with tooltips being displayed for each series:

Further Reading
To learn more about cursors and legends in SciChart please find links to the corresponding documentation articles below: