
It is possible to create Vertical (Rotated) Charts with SciChart. This transposes the entire chart, swapping X-Axis for Y and renders series top to bottom intead of left to right. Tooltips and markers also are transposed to the final effect is like a vertical chart.
Above: The JavaScript Oil and Gas Dashboard showcase from the SciChart.js Demo, showing a use-case of transposing the X,Y axis to achieve a vertical chart, visualising well drill depth.
To achieve this, simply set axis.axisAlignment to Left or Right for X Axis and Top or Bottom for Y Axis. And that's it - SciChart takes care of the rest:
This results in the following output, where the XAxis is on the left, the YAxis is on the top. The chart series is rotated automatically and now draws top to bottom, rather than left to right.
<div id="scichart-root" ></div>
body { margin: 0; }
#scichart-root { width: 100%; height: 100vh; }
async function verticalCharts(divElementId) {
// #region ExampleA
// Demonstrates how to configure a vertical chart in SciChart.js
const {
  SciChartSurface,
  NumericAxis,
  SciChartJsNavyTheme,
  EAxisAlignment,
  HorizontalLineAnnotation,
  ELabelPlacement,
  FastLineRenderableSeries,
  XyDataSeries
} = SciChart;

// or, for npm, import { SciChartSurface, ... } from "scichart"

const { wasmContext, sciChartSurface } = await SciChartSurface.create(divElementId, {
  theme: new SciChartJsNavyTheme()
});

// Add the xAxis to the chart
sciChartSurface.xAxes.add(new NumericAxis(wasmContext, {
  axisTitle: "X Axis",
  axisAlignment: EAxisAlignment.Left
}));

// Creating a NumericAxis as a YAxis on the left
sciChartSurface.yAxes.add(new NumericAxis(wasmContext, {
  axisTitle: "Y Axis",
  axisAlignment: EAxisAlignment.Top
}));

// Show how a line series responds to vertical chart
const xValues = [0,1,2,3,4,5,6,7,8,9,10,11,12,13,14,15,16,17,18,19];
const yValues = xValues.map(x => Math.sin(x * 0.4));
sciChartSurface.renderableSeries.add(new FastLineRenderableSeries(wasmContext, {
  dataSeries: new XyDataSeries(wasmContext, {
    xValues,
    yValues
  }),
  stroke: "#0066FF",
  strokeThickness: 3,
}));

// Show how a HorizontalLineAnnotation responds to vertical chart
sciChartSurface.annotations.add(new HorizontalLineAnnotation({
  // normally we set y1 but with vertical charts, we set annotation.x1
  x1: 10,
  labelValue: "HorizontalLineAnnotation with x1 = 10",
  showLabel: true,
  stroke: "#F48420",
  strokeThickness: 2,
  labelPlacement: ELabelPlacement.TopLeft
}));
// #endregion
};
verticalCharts("scichart-root");
async function builderExample(divElementId) {
// #region ExampleB
// Demonstrates how to configure a vertical chart in SciChart.js using the Builder API
const {
  chartBuilder,
  EThemeProviderType,
  EAxisType,
  EAxisAlignment
} = SciChart;

// or, for npm, import { chartBuilder, ... } from "scichart"

const xValues = [0,1,2,3,4,5,6,7,8,9,10,11,12,13,14,15,16,17,18,19];
const yValues = xValues.map(x => Math.sin(x * 0.4));

const { wasmContext, sciChartSurface } = await chartBuilder.build2DChart(divElementId, {
  surface: { theme: { type: EThemeProviderType.Dark } },
  xAxes: {
    type: EAxisType.NumericAxis,
    options: {
      axisTitle: "X Axis",
      axisAlignment: EAxisAlignment.Left
    }
  },
  yAxes: {
    type: EAxisType.NumericAxis,
    options: {
      axisTitle: "Y Axis",
      axisAlignment: EAxisAlignment.Top
    }
  },
  series: [
    {
      type: ESeriesType.LineSeries,
      options: {
        stroke: "#0066FF",
        strokeThickness: 3,
      },
      xyData: {
        xValues,
        yValues
      }}
  ]
});
// #endregion
};
// Uncomment this to use the builder example
//builderExample("scichart-root");
Flipping the Axis when Horizontal or Vertical.
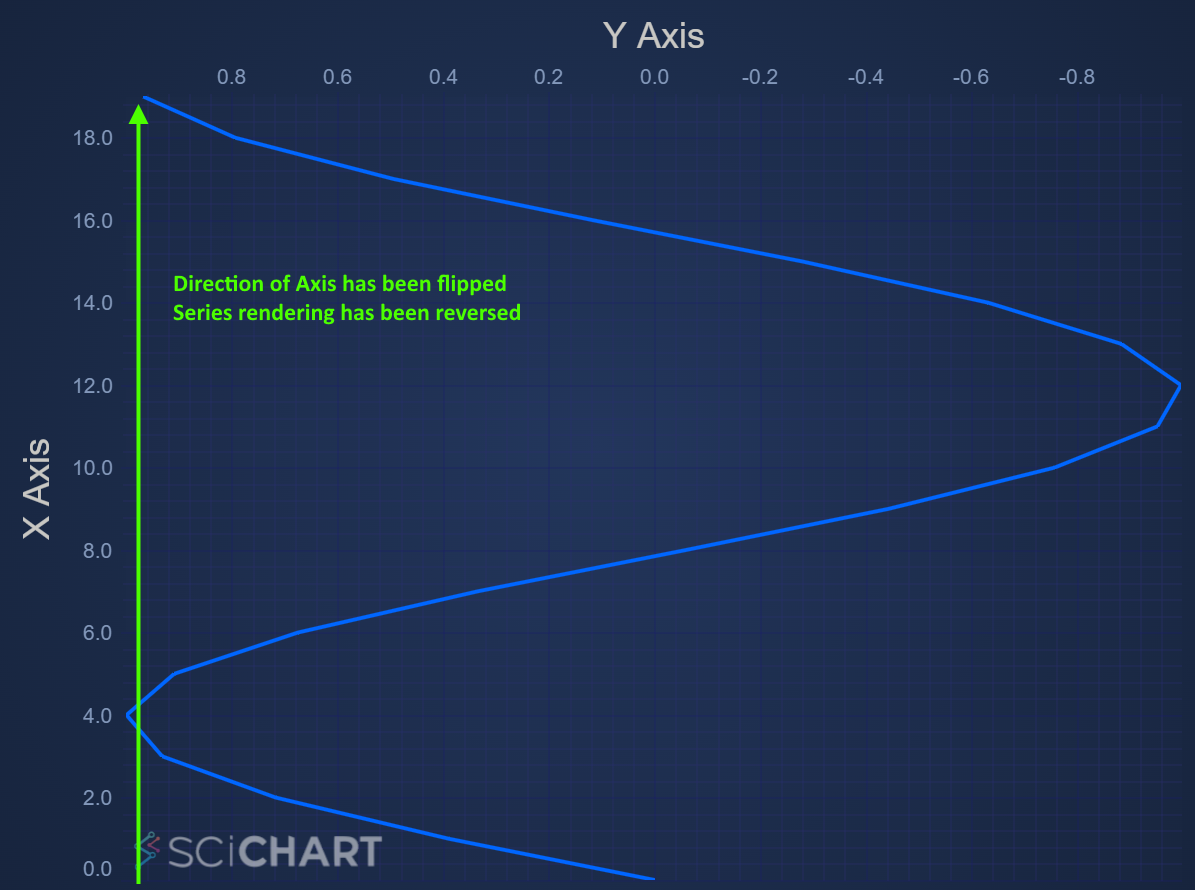
An Axis may be flipped when horizontal or vertical (coordinates drawn in opposite directions) by setting the AxisCore.flippedCoordinates property.
For example, taking the code sample above, and setting xAxis.flippedCoordinates = true, we get the following result. Notice the XAxis is now drawn in reverse and the series is now drawn from bottom to top..
Considerations when using Vertical Charts
This Flexibility of SciChart allows for some pretty interesting configurations of charts. However, here are some considerations when using a Vertical Chart.
- Tooltips, Cursors and the RolloverModifier will also be transposed (rotated 90 degrees). When applying a RolloverModifier the cursor line is usually vertical, but in a vertical chart the cursor line will be horizontal.
- Annotations will behave differently. For example a HorizontalLineAnnotation will still draw horizontally but instead of setting the y1 property to place on the YAxis, now you must set x1 property to place on the XAxis.