
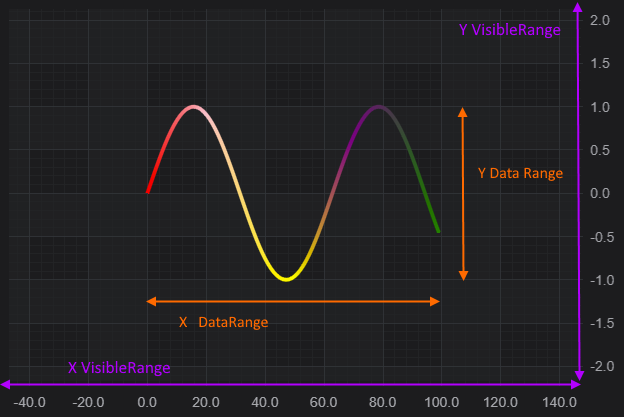
What is VisibleRange?
VisibleRange is an actual axis range, measured in chart units. This is a part of a chart that is currently visible in a viewport.
This is a different concept to the Data Range, which is the extents of the data on the chart.
The diagram below explains the concept of the VisibleRange:
Setting Axis.VisibleRange Programmatically
To programmatically range an axis, set the AxisCore.visibleRange property with a NumberRange type.
This results in the following output:
<div class="container">
<div id="scichart-root" ></div>
<button class="button" id="update-chart-button">Change VisibleRange</button>
<label id="update-range-label"></label>
</div>
body { margin: 0; font-family: Arial; }
.container { width: 100%; height: 100vh; position: relative; }
#scichart-root { width: 100%; height: 100%; }
#update-chart-button {
position: absolute;
left: 20px;
top: 20px;
border: 1px solid #14233C;
background-color: #364BA0;
border-radius: 3px;
color: #FFFFFF;
padding: 15px 22px;
text-align: center;
text-decoration: none;
display: inline-block;
font-size: 16px;
margin: 4px 2px;
cursor: pointer;
transition-duration: 0.4s;
}
#update-chart-button:hover {
background-color: #537ABD;
}
#update-range-label {
color: #FFFFFF77;
position: absolute;;
left: 25px;
top: 75px;
}
async function getSetVisibleRange(divElementId) {
// #region ExampleA
const {
  SciChartSurface,
  NumericAxis,
  SciChartJsNavyTheme,
  NumberRange,
} = SciChart;

// or, for npm, import { SciChartSurface, ... } from "scichart"

// Create a chart with X,Y axis
const { wasmContext, sciChartSurface } = await SciChartSurface.create(divElementId, {
  theme: new SciChartJsNavyTheme()
});
sciChartSurface.xAxes.add(new NumericAxis(wasmContext));
sciChartSurface.yAxes.add(new NumericAxis(wasmContext));

// Allow updating visibleRange
document.getElementById("update-chart-button").addEventListener("click", () => {
  const yAxis = sciChartSurface.yAxes.get(0);

  const min = Math.random() * 0.5;
  yAxis.visibleRange = new NumberRange(min, min + 1);
  const range = yAxis.visibleRange;
  const message = `YAxis VisibleRange is ${range.min.toFixed(2)}, ${range.max.toFixed(2)}`;
  document.getElementById("update-range-label").textContent = message;
  console.log(message);
});
// #endregion
// Outside the public documentation - lets add some data to show autorange
const { FastLineRenderableSeries, XyDataSeries } = SciChart;
const xValues = [0,1,2,3,4,5,6,7,8,9,10,11,12,13,14,15,16,17,18,19];
const yValues = xValues.map(x => Math.sin(x * 0.2));
const dataSeries = new XyDataSeries(wasmContext, { xValues, yValues });
sciChartSurface.renderableSeries.add(new FastLineRenderableSeries(wasmContext, {
dataSeries,
stroke: "#50C7E0",
strokeThickness: 3,
}));
};
getSetVisibleRange("scichart-root");
async function builderExample(divElementId) {
const {
chartBuilder,
ESeriesType,
EThemeProviderType,
EAxisType,
NumberRange
} = SciChart;
// or, for npm, import { chartBuilder, ... } from "scichart"
const xValues = [0,1,2,3,4,5,6,7,8,9,10,11,12,13,14,15,16,17,18,19];
const yValues = xValues.map(x => Math.sin(x * 0.2));
// #region ExampleB
const { wasmContext, sciChartSurface } = await chartBuilder.build2DChart(divElementId, {
  surface: { theme: { type: EThemeProviderType.Dark } },
  xAxes: {
    type: EAxisType.NumericAxis,
    options: { axisTitle: "X Axis" }
  },
  yAxes: {
    type: EAxisType.NumericAxis,
    options: {
      axisTitle: "Y Axis",
      visibleRange: new NumberRange(0, 1)
    }
  },
  series: [
    {
      type: ESeriesType.LineSeries,
      xyData: {
        xValues,
        yValues
      },
      options: {
        stroke: "#50C7E0",
        strokeThickness: 3,
      }
    }
  ]
});

document.getElementById("update-chart-button").addEventListener("click", () => {
  const yAxis = sciChartSurface.yAxes.get(0);

  console.log(`Setting Axis.VisibleRange = -0.2, 1.2`);
  yAxis.visibleRange = new NumberRange(-0.2, 1.2);
  const range = yAxis.visibleRange;
  console.log(`Axis VisibleRange is ${range.min}, ${range.max}`);
});
// #endregion
};
// Uncomment this to use the builder example
//builderExample("scichart-root");
Note the CategoryAxis is treated as a special case. Although it has the same property CategoryAxis.visibleRange of type NumberRange, it expects values to be indices, not data-values.
The reason for this is that this axis type works with with data indexes, not actual data values. So a NumberRange should be applied instead, with lower data index as Min and Upper data index as Max.
To learn more about how to convert values from Data-values to Indexes and back in a CategoryAxis, please refer to the Convert Pixels to Data Coordinates article.
Zooming to fit all the Data
Sometimes it is required to make an axis to show the full extent of the data associated with it. There are several ways to achieve this in code:
- Set the visibleRange equal to axis.getMaximumRange()
- Configure the axis to auto adjust correspondingly to data changes. See the article AxisRanging - AutoRange.
- call the functions from SciChartSurface such as ZoomExtents(), ZoomExtentsY() and ZoomExtentsX() to force a zoom to fit operation once.
Try this example below:
This results in the following output:
<div class="container">
<div id="scichart-root" ></div>
<button class="button" id="update-chart-button">Zoom to Fit</button>
<label id="update-range-label"></label>
</div>
body { margin: 0; font-family: Arial; }
.container { width: 100%; height: 100vh; position: relative; }
#scichart-root { width: 100%; height: 100%; }
#update-chart-button {
    position: absolute;
    left: 20px;
    top: 20px;
    border: 1px solid #14233C;
    background-color: #364BA0;
    border-radius: 3px;
    color: #FFFFFF;
    padding: 15px 22px;
    text-align: center;
    text-decoration: none;
    display: inline-block;
    font-size: 16px;
    margin: 4px 2px;
    cursor: pointer;
    transition-duration: 0.4s;
}
#update-chart-button:hover {
    background-color: #537ABD;
}
#update-range-label {
    color: #FFFFFF77;
    position: absolute;;
    left: 25px;
    top: 75px;
}
async function zoomExtents(divElementId) {
// #region ExampleA
const {
  SciChartSurface,
  NumericAxis,
  SciChartJsNavyTheme,
  NumberRange,
} = SciChart;

// or, for npm, import { SciChartSurface, ... } from "scichart"

// Create a chart with X,Y axis
const { wasmContext, sciChartSurface } = await SciChartSurface.create(divElementId, {
  theme: new SciChartJsNavyTheme()
});
sciChartSurface.xAxes.add(new NumericAxis(wasmContext, { visibleRange: new NumberRange(-2, 20) }));
sciChartSurface.yAxes.add(new NumericAxis(wasmContext, { visibleRange: new NumberRange(-2, 2) }));

document.getElementById("update-chart-button").addEventListener("click", () => {
  // Zoom to fit the chart
  const optionalAnimationDelay = 2000;
  sciChartSurface.zoomExtents(optionalAnimationDelay);

  // See also zoomExtentsY(), zoomExtentsX()
});
// #endregion
// Outside the public documentation - lets add some data to show autorange
const { FastLineRenderableSeries, XyDataSeries } = SciChart;
const xValues = [0,1,2,3,4,5,6,7,8,9,10,11,12,13,14,15,16,17,18,19];
const yValues = xValues.map(x => Math.sin(x * 0.2));
const dataSeries = new XyDataSeries(wasmContext, { xValues, yValues });
sciChartSurface.renderableSeries.add(new FastLineRenderableSeries(wasmContext, {
dataSeries,
stroke: "#50C7E0",
strokeThickness: 3,
}));
};
zoomExtents("scichart-root");
async function builderExample(divElementId) {
const {
chartBuilder,
ESeriesType,
EThemeProviderType,
EAxisType,
NumberRange
} = SciChart;
// or, for npm, import { chartBuilder, ... } from "scichart"
const xValues = [0,1,2,3,4,5,6,7,8,9,10,11,12,13,14,15,16,17,18,19];
const yValues = xValues.map(x => Math.sin(x * 0.2));
// #region ExampleB
const { wasmContext, sciChartSurface } = await chartBuilder.build2DChart(divElementId, {
  surface: { theme: { type: EThemeProviderType.Dark } },
  xAxes: {
    type: EAxisType.NumericAxis,
    options: { axisTitle: "X Axis", visibleRange: new NumberRange(-2, 20) }
  },
  yAxes: {
    type: EAxisType.NumericAxis,
    options: {
      axisTitle: "Y Axis",
      visibleRange: new NumberRange(-2, 2)
    }
  },
  series: [
    {
      type: ESeriesType.LineSeries,
      xyData: {
        xValues,
        yValues
      },
      options: {
        stroke: "#50C7E0",
        strokeThickness: 3,
      }
    }
  ]
});

document.getElementById("update-chart-button").addEventListener("click", () => {
  // Zoom to fit the chart
  const optionalAnimationDelay = 2000;
  sciChartSurface.zoomExtents(optionalAnimationDelay);

  // See also zoomExtentsY(), zoomExtentsX()
});
// #endregion
};
// Uncomment this to use the builder example
//builderExample("scichart-root");
What if you want to allow the user to zoom to fit using the mouse? All the zooming, panning operations via mouse or touch are handled by ChartModifiers in SciChart.js. See the ZoomPanModifier, ZoomExtentsModifier for information.