
Tutorial 05 - Adding Tooltips and Legends
Adding Tooltips & Legends to a Chart
Source code for this tutorial can be found at our SciChart.WPF.Examples Github Repository under Tutorials section.
So far in the tutorial series, we have created a new chart, added an XAxis, YAxis, some series and also some zoom and pan behaviours.
We're going to extend this now to add Legends and Tooltips to the chart. Modify the XAML from Tutorial 04 - Adding Zooming, Panning Behavior as follows.
| Adding Tooltips and Legends to the chart |
Copy Code |
|---|---|
<Window x:Class="SciChart.Tutorial.MainWindow" xmlns="http://schemas.microsoft.com/winfx/2006/xaml/presentation" xmlns:x="http://schemas.microsoft.com/winfx/2006/xaml" xmlns:d="http://schemas.microsoft.com/expression/blend/2008" xmlns:mc="http://schemas.openxmlformats.org/markup-compatibility/2006" xmlns:s="http://schemas.abtsoftware.co.uk/scichart" mc:Ignorable="d" Title="MainWindow" Height="550" Width="800"> <Grid Background="#222"> <Grid.RowDefinitions> <RowDefinition Height="*"/> <RowDefinition Height="Auto"/> </Grid.RowDefinitions> <s:SciChartSurface x:Name="sciChartSurface"> <s:SciChartSurface.RenderableSeries> <s:FastLineRenderableSeries x:Name="LineSeries" Stroke="#FF4083B7"/> <s:XyScatterRenderableSeries x:Name="ScatterSeries" > <s:XyScatterRenderableSeries.PointMarker> <s:EllipsePointMarker Width="7" Height="7" Fill="#FFF" Stroke="SteelBlue"/> </s:XyScatterRenderableSeries.PointMarker> </s:XyScatterRenderableSeries> </s:SciChartSurface.RenderableSeries> <s:SciChartSurface.XAxis> <s:NumericAxis AxisTitle="Number of Samples (per Series)"/> </s:SciChartSurface.XAxis> <s:SciChartSurface.YAxis> <s:NumericAxis AxisTitle="Value"/> </s:SciChartSurface.YAxis> <s:SciChartSurface.ChartModifier> <s:ModifierGroup> <s:RubberBandXyZoomModifier ExecuteOn="MouseLeftButton" RubberBandFill="#33FFFFFF" RubberBandStroke="#AAFFFFFF" RubberBandStrokeDashArray="2 2"/> <s:ZoomPanModifier ExecuteOn="MouseRightButton" ClipModeX="None" /> <s:YAxisDragModifier DragMode="Scale"/> <s:XAxisDragModifier DragMode="Pan"/> <s:MouseWheelZoomModifier/> <s:ZoomExtentsModifier ExecuteOn="MouseDoubleClick" /> <!-- NEW CODE HERE --> <!-- Add a Legend to the chart --> <!-- where xmlns:s="http://schemas.abtsoftware.co.uk/scichart" --> <s:LegendModifier ShowLegend="True" Orientation="Horizontal" VerticalAlignment="Bottom" HorizontalAlignment="Center" LegendPlacement="Inside" /> <!-- Add a RolloverModifier to the chart (shows vertical line tooltips --> <s:RolloverModifier ExecuteOn="MouseMove" ShowTooltipOn="MouseHover"/> <!-- END NEW CODE --> </s:ModifierGroup> </s:SciChartSurface.ChartModifier> <s:SciChartSurface.Annotations> <s:TextAnnotation Text="Hello world!" X1="5.0" Y1="5"/> </s:SciChartSurface.Annotations> </s:SciChartSurface> <s:SciChartScrollbar Grid.Row="1" Axis="{Binding ElementName=sciChartSurface, Path=XAxis}"/> </Grid> </Window> | |
The legends require that DataSeries are named. So in code behind, we adjust the code from Tutorial 03 - Adding Series to the chart to give series a name:
| Naming DataSeries for the Legend |
Copy Code |
|---|---|
using System; using System.Windows; using SciChart.Charting.Model.DataSeries; namespace SciChart.Tutorial { public partial class MainWindow : Window { public MainWindow() { InitializeComponent(); this.Loaded += OnLoaded; } private void OnLoaded(object sender, RoutedEventArgs routedEventArgs) { var scatterData = new XyDataSeries<double, double>(); var lineData = new XyDataSeries<double, double>(); // NEW CODE HERE // Ensure that DataSeries are named for the legend scatterData.SeriesName = "Cos(x)"; lineData.SeriesName = "Sin(x)"; // END NEW CODE for (int i = 0; i < 1000; i++) { lineData.Append(i, Math.Sin(i * 0.1)); scatterData.Append(i, Math.Cos(i * 0.1)); } LineSeries.DataSeries = lineData; ScatterSeries.DataSeries = scatterData; } } } | |
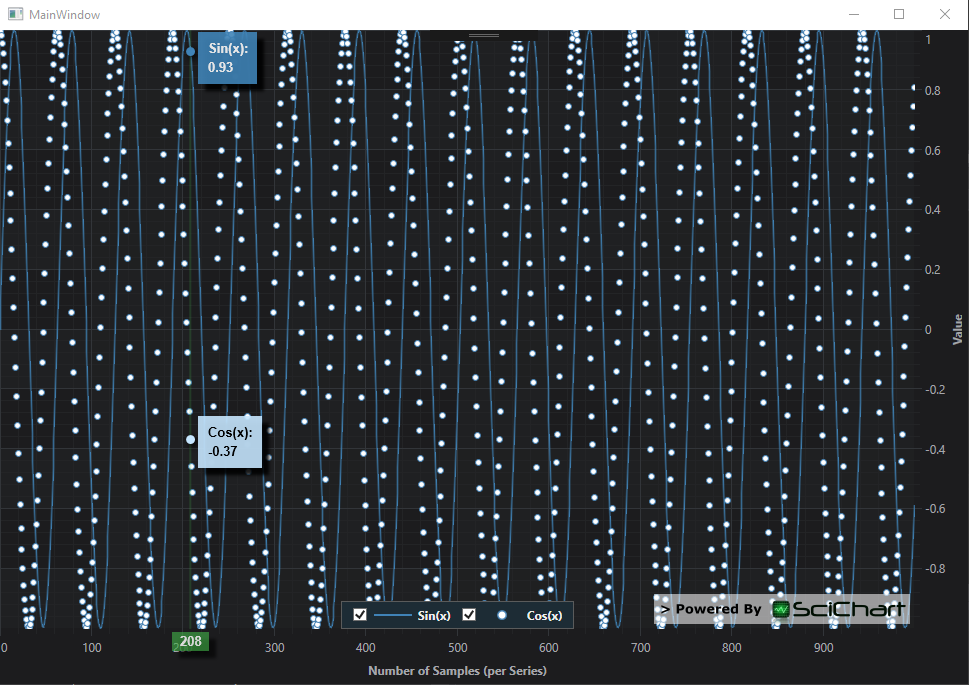
Here is the result!
Further Reading
SciChart featurse a number of tooltip types, as well as cursors, and each of the elements are fully customizable. Please see the articles below to see how to further customize the chart legends and tooltips:
- The RolloverModifier - adding time series tooltips to a chart
- The CursorModifier - adding crosshairs and optional tooltips
- The TooltipModifier - tooltips more suited for scatter or irregular data
- The VerticalSliceModifier - similar to a rollover, but with multiple draggable cursors
- The LegendModifier - creating, customizing and templating legends
See Also