SciChart.js features a rich Annotations API, that allows you to place annotations (boxes, markers, text labels and custom shapes) over a chart:
Annotations can provide interactive event/news bullets, horizontal/vertical lines (thresholds), text/callouts as well as measurements such as Peak-to-peak or cycle duration. Annotations can be edited by click & drag, added by touching a screen, or, simply created programmatically. SciChart provides a number of built-in annotations, but you can also create your own. To find out more about annotations features, please see the Common Annotations Features article.
Annotation Types
The following annotation types are available out of the box in SciChart:
| Type | Description |
| BoxAnnotation | Draws a rectangle at specific X1, X2, Y1, Y2 coordinates. |
| LineAnnotation | Draws a line between X1, Y1 and X2, Y2 positions. |
| HorizontalLineAnnotation | Draws a horizontal line at a given y position, with various labelling options |
| VerticalLineAnnotation | Draws a vertical line at a given x position, with various labelling options |
| TextAnnotation | Allows to place a piece of text at a specific location on a chart. |
| NativeTextAnnotation | Draws text natively rather than using svg, supporting rotation, multiline, wordwrap and scaling |
| CustomAnnotation |
Allows to place any SVG Content at a specific location on a chart. |
| CustomAxisMarkerAnnotation | Uses an image instead of text for an axis marker |
To learn more about any annotation type, please refer to the corresponding article.
Adding an Annotation to a Chart
The SciChartSurface stores all its annotations in the SciChartSurface.annotations collection. The following code can be used to add an annotation to a chart:
This results in the following output:
<div id="scichart-root"></div>
body {
margin: 0;
}
#scichart-root {
width: 100%;
height: 100vh;
}
// #region ExampleA
const {
  BoxAnnotation,
  NumericAxis,
  SciChartSurface,
  NumberRange,
  EHorizontalAnchorPoint,
  EVerticalAnchorPoint,
  ECoordinateMode,
  SciChartJsNavyTheme,
} = SciChart;

// or for npm import { SciChartSurface, ... } from "scichart"

async function addAnnotationToChart(divElementId) {
  const { wasmContext, sciChartSurface } = await SciChartSurface.create(
    divElementId,
    {
      theme: new SciChartJsNavyTheme(),
    }
  );
  sciChartSurface.xAxes.add(new NumericAxis(wasmContext));
  sciChartSurface.yAxes.add(new NumericAxis(wasmContext));

  // Add a selection of annotations to the chart
  sciChartSurface.annotations.add(
    new LineAnnotation({
      stroke: "#FF6600",
      strokeThickness: 3,
      x1: 2.0,
      x2: 8.0,
      y1: 3.0,
      y2: 7.0,
    }),
    new BoxAnnotation({
      stroke: "#FF3333",
      strokeThickness: 1,
      fill: "rgba(255,50,50,0.3)",
      x1: 2.0,
      x2: 8.0,
      y1: 3.0,
      y2: 7.0,
    }),
    new BoxAnnotation({
      stroke: "#33FF33",
      strokeThickness: 1,
      fill: "rgba(50, 255, 50, 0.3)",
      x1: 3.0,
      x2: 9.0,
      y1: 4.0,
      y2: 8.0,
    }),
    new TextAnnotation({
      x1: 100,
      y1: 0.5,
      xCoordinateMode: ECoordinateMode.Pixel,
      yCoordinateMode: ECoordinateMode.Relative,
      horizontalAnchorPoint: EHorizontalAnchorPoint.Left,
      verticalAnchorPoint: EVerticalAnchorPoint.Center,
      textColor: "yellow",
      fontSize: 26,
      fontFamily: "Arial",
      text: "TEXT ANNOTATION",
    })
  );
}

addAnnotationToChart("scichart-root");
// #endregion
async function builderExample(divElementId) {
// #region ExampleB
const { chartBuilder, EAnnotationType, ECoordinateMode } = SciChart;

// or for npm import { SciChartSurface, ... } from "scichart"

const { wasmContext, sciChartSurface } = await chartBuilder.build2DChart(
  divElementId,
  {
    annotations: [
      {
        type: EAnnotationType.RenderContextBoxAnnotation,
        options: {
          stroke: "#FF3333",
          strokeThickness: 1,
          fill: "rgba(255,50,50,0.3)",
          x1: 2.0,
          x2: 8.0,
          y1: 3.0,
          y2: 7.0,
        },
      },
      {
        type: EAnnotationType.RenderContextBoxAnnotation,
        options: {
          stroke: "#33FF33",
          strokeThickness: 1,
          fill: "rgba(50,255,50,0.3)",
          x1: 3.0,
          x2: 9.0,
          y1: 4.0,
          y2: 8.0,
        },
      },
      {
        type: EAnnotationType.SVGTextAnnotation,
        options: {
          x1: 100,
          y1: 0.5,
          xCoordinateMode: "Pixel",
          yCoordinateMode: "Relative",
          horizontalAnchorPoint: "Left",
          verticalAnchorPoint: "Center",
          textColor: "yellow",
          fontSize: 26,
          fontFamily: "Times New Roman",
          text: "TEXT ANNOTATION",
        },
      },
    ],
  }
);
// #endregion
}
// Uncomment this to use the builder example //builderExample("scichart-root");
Individual Annotation features are discussed in greater detail in the following pages:
- The BoxAnnotation Type
- The LineAnnotation Type
- The TextAnnotation Type
- The CustomAnnotation Type
Common Annotation Properties
All annotations in SciChart.js are derived from the AnnotationBase type. Individual Annotations have additional properties however the following common properties of the AnnotationBase class listed below can be used to control all annotation types.
| AnnotationBase Property | Description |
| annotationLayer |
Determines which canvas the annotation should be placed on. The default is EAnnotationLayer.AboveChart, where annotations are displayed above the chart series. Setting this property to EAnnotationLayer.BelowChart places an annotation below series but above gridlines, axis bands and axis labels. Note that this method doesn't work with SVG based annotations such as TextAnnotation and CustomAnnotation. Finally, setting the property to EAnnotationLayer.Background, places an annotation below all elements on the chart (series, axis bands, gridlines, axis labels). This method works with all annotation types including SVG, and is useful for placing watermarks on the chart. |
| xCoordinateMode, yCoordinateMode |
Determines how coordinates x1,y2,x2,y2 are used when placing the annotation. X/YCoordinateMode should be used to place watermarks, or annotations anchored to the top or bottom of the viewport etc…
The default is ECoordinateMode.DataValue. In this mode, x1,y2,x2,y2 correspond to Data-values and the annotion position will update as you zoom and pan the chart. ECoordinateMode.Relative means that coordinates are relative to the viewport. The annotation does not update position as you zoom and pan. E.g. x1=0.0 and y1=0.0 means the annotation will be placed in the top-left corner of the Viewport and x1=1.0, y1=1.0 corresponds to the bottom-left corner of the viewport always (regardless of Zoom or Pan). ECoordinateMode.Pixel means that coordinates are pixel values relative to the top-left of the viewport. These are also useful to dock annotations to a specific |
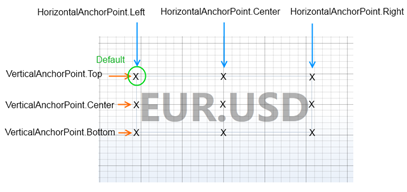
| horizontalAnchorPoint, verticalAnchorPoint |
The horizontalAnchorPoint, verticalAnchorPoint properties are used to adjust the alignment of certain annotations.
Above: HorizontalAnchorPoint, VerticalAnchorPoint when applied to a TextAnnotation |
| isHidden | isHidden can be set to show or hide an annotation. |
| hovered, isHovered, selectedChanged, isSelected | Annotations can be made interactive with selection and hover callbacks. To find out how to enable this, read the Annotation Hover page. |
| resizeDirections | Allows you to specify which direction (X, Y, Xy) an annotation may be resized in. |
| dragStarted, dragDelta, dragEnded | Callbacks may be registered when an annotation is dragged by the user |
| x1,x2,y1,y2 |
x1,x2,y1,y2 properties are set to define the position of the annotation on the parent chart. Note that annotation position is also defined by the xCoordinateMode, yCoordinateMode properties, which allow you to place annotations using data-values, relative to the viewport or absolute pixel coordinates. |
| xAxisId, yAxisId |
In a multiple-axis scenario, AnnotationBase.xAxisId or yAxisId property is used to bind the annotation to a specific X or Y-Axis. NOTE: This value must be supplied if you have axis with non-default Axis Ids. |
| isEditable | If true, this annotation can be selected and dragged/resized. See Editable Annotations for more details |
| clicked / onClick |
clicked is an event on the annotation which you can subscribe to to be notified when the annotation is clicked. This is fired for both editable and non-editable annotations. You can pass a callback for this using the onClick property of the IAnnotationBaseOptions. The event arguments contain a point which gives the coordinates of where on the annotation it was clicked, relative to the top left corner. NOTE: If and editable annotation is already selected, clicking on it will fire dragStarted, but not clicked |