Realtime Ticking Stock Charts powered by SciChart
Ever felt the need for speed in your trading applications?
We have! Which is why we’ve created SciStockChart – a WPF Stock chart control supporting Candlestick, OHLC and linked multi-pane charts, available as part of SciChart WPF 2D Charts. SciStockChart supports Candlestick, OHLC, Mountain, Column, Line, Scatter and Banded plots out of the box, on a 2D chart-surface with numeric Y-Axis and Category DateTime X-Axis.
Scrolling WPF Charts with the Overview Control
We have built the SciChart framework by working alongside seasoned traders to bring you a truly high-performance, interactive experience for your trading applications. You’ll find SciChart’s interactivity a joy to use, with optional support of XY cursor, pan on mouse-drag, Axis drag to zoom, mouse-wheelzoom and rubber-band (drag) zoom. Quickly pan around the chart to find an area of interest, scroll horizontally using the Overview control.
// Realtime Charting Performance
In a real-time context SciChart really shines. We understand that you want your users to be able to concentrate on trading, and not worry about hangs or performance issues in the charting software. SciChart can handle even the most demanding scenarios in a trading application such as spanning multiple monitors (tested up to 3800 x 1200 pixels), or multiple charts with live market data. Such performance in a will give you the peace of mind that you can deliver the trading systems that your users want.
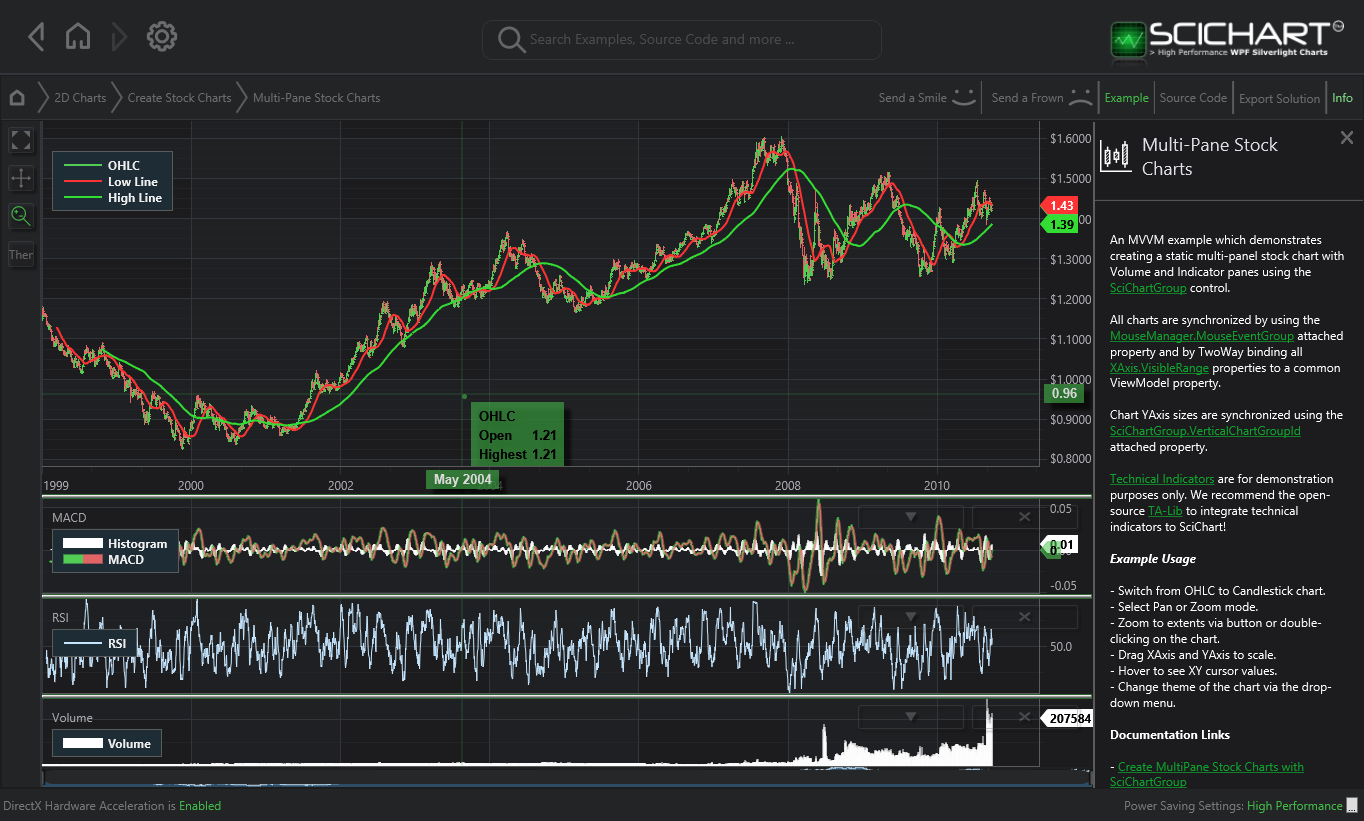
Multi-Pane Stock Charts provided by SciChartGroup
// Multi Pane Stock Charts
Our WPF Stock chart is complemented by the SciChartGroup control, enabling stacked or tabbed multi-pane stock charts. Add or remove indicator & volume panes, all of which update in sync with the main price pane. View cursors across multiple charts, aggregate latest price & volume data and more…
// Annotations
Did we mention annotations? We understand any trading application worth its salt allows programmatic, or user-defined annotations. SciChart supports Text, Line, LineArrow, Box, HorizontalLine, VerticalLine annotations out of the box, and our CustomAnnotation type allows you to draw any WPF UIElement at a predefined location. Furthermore, you can extend SciChart by adding your own custom interactivity modifiers, drawing any WPF UIElement over the chart or even completely re-templating the control in Xaml!
I would like to drop you a quick line to say thank you for a brilliant product in SciCharts, which has outperformed my initial expectations. The Charts are smooth, fast and very professional looking and give our product the polished feel we were looking for. Overall, I am very impressed with SciCharts and the work you and your team have been doing, you are head and shoulders above the competition! Steve Griffiths, MT Predictor Ltd
DOWNLOAD FREE TRIAL VIEW CHART PRICING
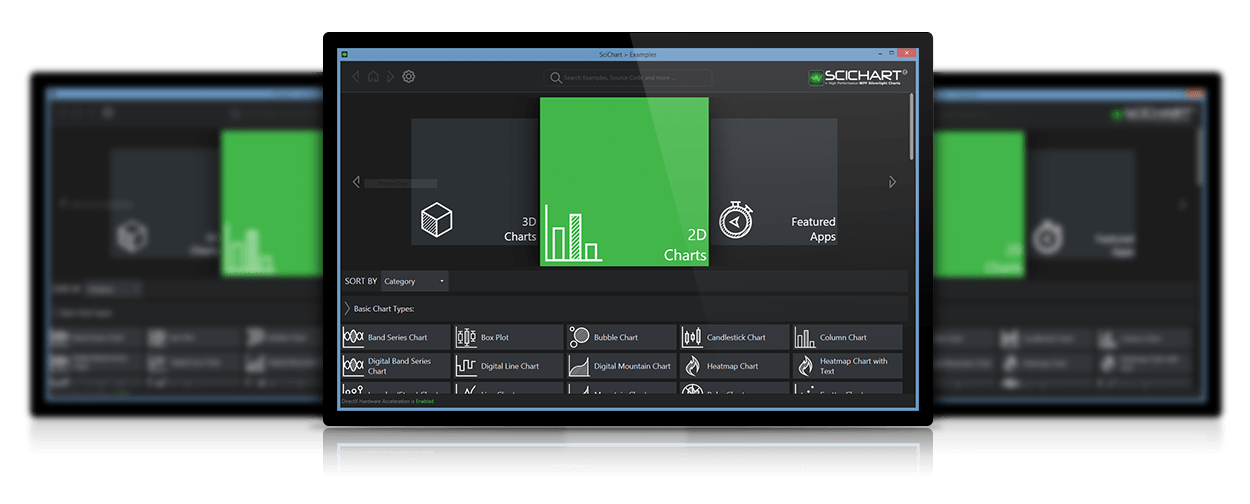
Comprehensive WPF Charting Examples and Documentation
No other WPF Charting vendor supplies such comprehensive examples and documentation! Our examples suite contains over 125 live WPF Chart examples which you can export to a stand-alone Visual Studio project straight away. SciChart WPF Charts are backed by 1,500 forum questions, 300+ pages of documentation as well as a knowledgeable and responsive development team to help you achieve the best from SciChart.
All this starting from $899 / Developer License
SciChart’s WPF Charts are licensed on a perpetual, per-developer licensing model, with royalty free redistribution. You get access to the world’s best WPF Charts, starting from just $899 per developer license.
