The tutorials don’t include the SciChart WPF Assembly – you will need to download this from http://www.scichart.com/downloads/ and update the reference in the Visual Studio project. Can you try this and let me know if you have any success?
Also please note, when you install the latest version of SciChart, under /ABT Software Services Ltd/SciChart/Tutorials/ you can find all the tutorial solutions.
Just to make you aware, we also have a support forum where you can request support. You’ll need to log in to post. The URL is http://www.scichart.com/forums/
If you download the trial of SciChart from https://www.scichart.com/downloads, it includes all the tutorials which have been made up to date to compile with the latest version of SciChart. Can you try this?
Tutorials are installed under %Install Dir&/Tutorials/
Yes it is possible, you can bind SciChartSurface.DataSet to a property in a view model. Check out the tutorials Databinding Annotations in MVVM and also the example Bind SciChart to Data as these show two different techniques you can use to databind to a DataSet
Thank you, I saw that just after asking the question sorry. And what about chart refreshing ? In the EEGExample the OnTimer function only Append the new values in the IXyDataSeries objects but when I do myself it doesn’t. I guess it’s not sufficient but I don’t find what to add.
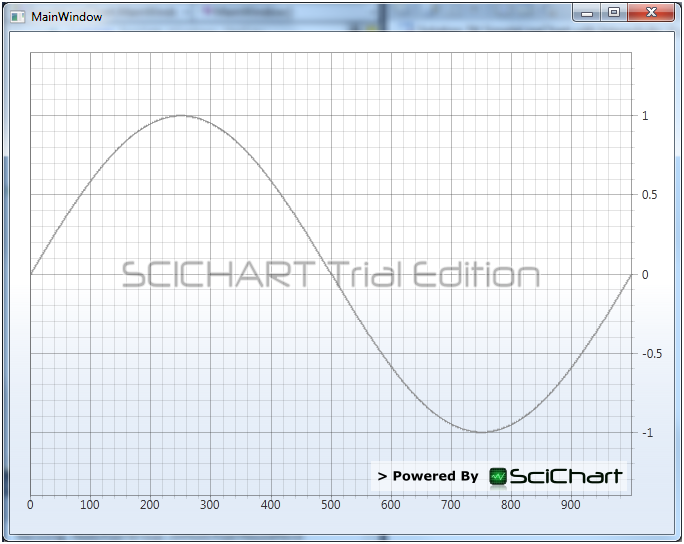
Hey there, by default the chart does not AutoRange. If you want to automatically see data after appending, call SciChartSurface.ZoomExtents();
Or, you can set SciChartSurface.XAxis.AutoRange = true, and YAxis.AutoRange = true.
Finally, if you have any more questions, feel free to head over to our support forum at http://www.scichart.com/forums/ where one of our team will be glad to help! 🙂
12 Comments
Hi together,
I’m new in C# and WPF and tried to follow the example above. But unfortunetly I got an error message during the compile process.
Fehler 1 Der Typ- oder Namespacename “DataSeriesSet” konnte nicht gefunden werden. (Fehlt eine Using-Direktive oder ein Assemblyverweis?)
Maybe I had to enter a USING-Direktive in the code behind. But I don’t find such a code snipplet in your example. Could you gave me an advice?
Regards
Norbert
Hello Norbert,
The tutorials don’t include the SciChart WPF Assembly – you will need to download this from http://www.scichart.com/downloads/ and update the reference in the Visual Studio project. Can you try this and let me know if you have any success?
Also please note, when you install the latest version of SciChart, under/ABT Software Services Ltd/SciChart/Tutorials/ you can find all the tutorial solutions.
Hope this helps!
Hi Andrew,
Yes, your reply was vary useful for me.
Thank You
Great! Glad to be of help.
Just to make you aware, we also have a support forum where you can request support. You’ll need to log in to post. The URL is http://www.scichart.com/forums/
Best regards,
Andrew
Hello.
I have a problem with this example.
I have an error:
Using the generic type ‘Abt.Controls.SciChart.DataSeriesSet’ requires 2 type arguments
Hi Kirill,
If you download the trial of SciChart from https://www.scichart.com/downloads, it includes all the tutorials which have been made up to date to compile with the latest version of SciChart. Can you try this?
Tutorials are installed under %Install Dir&/Tutorials/
Best regards,
Andrew
I fix this problem with current examples.
Thanks.
Hi !
Just I watch a lot of your example and data is always created in code behind but is it possible to set the data source in the XAML ?
Hello there,
Yes it is possible, you can bind SciChartSurface.DataSet to a property in a view model. Check out the tutorials Databinding Annotations in MVVM and also the example Bind SciChart to Data as these show two different techniques you can use to databind to a DataSet
Best regards,
Andrew
Thank you, I saw that just after asking the question sorry. And what about chart refreshing ? In the EEGExample the OnTimer function only Append the new values in the IXyDataSeries objects but when I do myself it doesn’t. I guess it’s not sufficient but I don’t find what to add.
Thank You
Hey there, by default the chart does not AutoRange. If you want to automatically see data after appending, call SciChartSurface.ZoomExtents();
Or, you can set SciChartSurface.XAxis.AutoRange = true, and YAxis.AutoRange = true.
Finally, if you have any more questions, feel free to head over to our support forum at http://www.scichart.com/forums/ where one of our team will be glad to help! 🙂
Thank you Andrew 😀