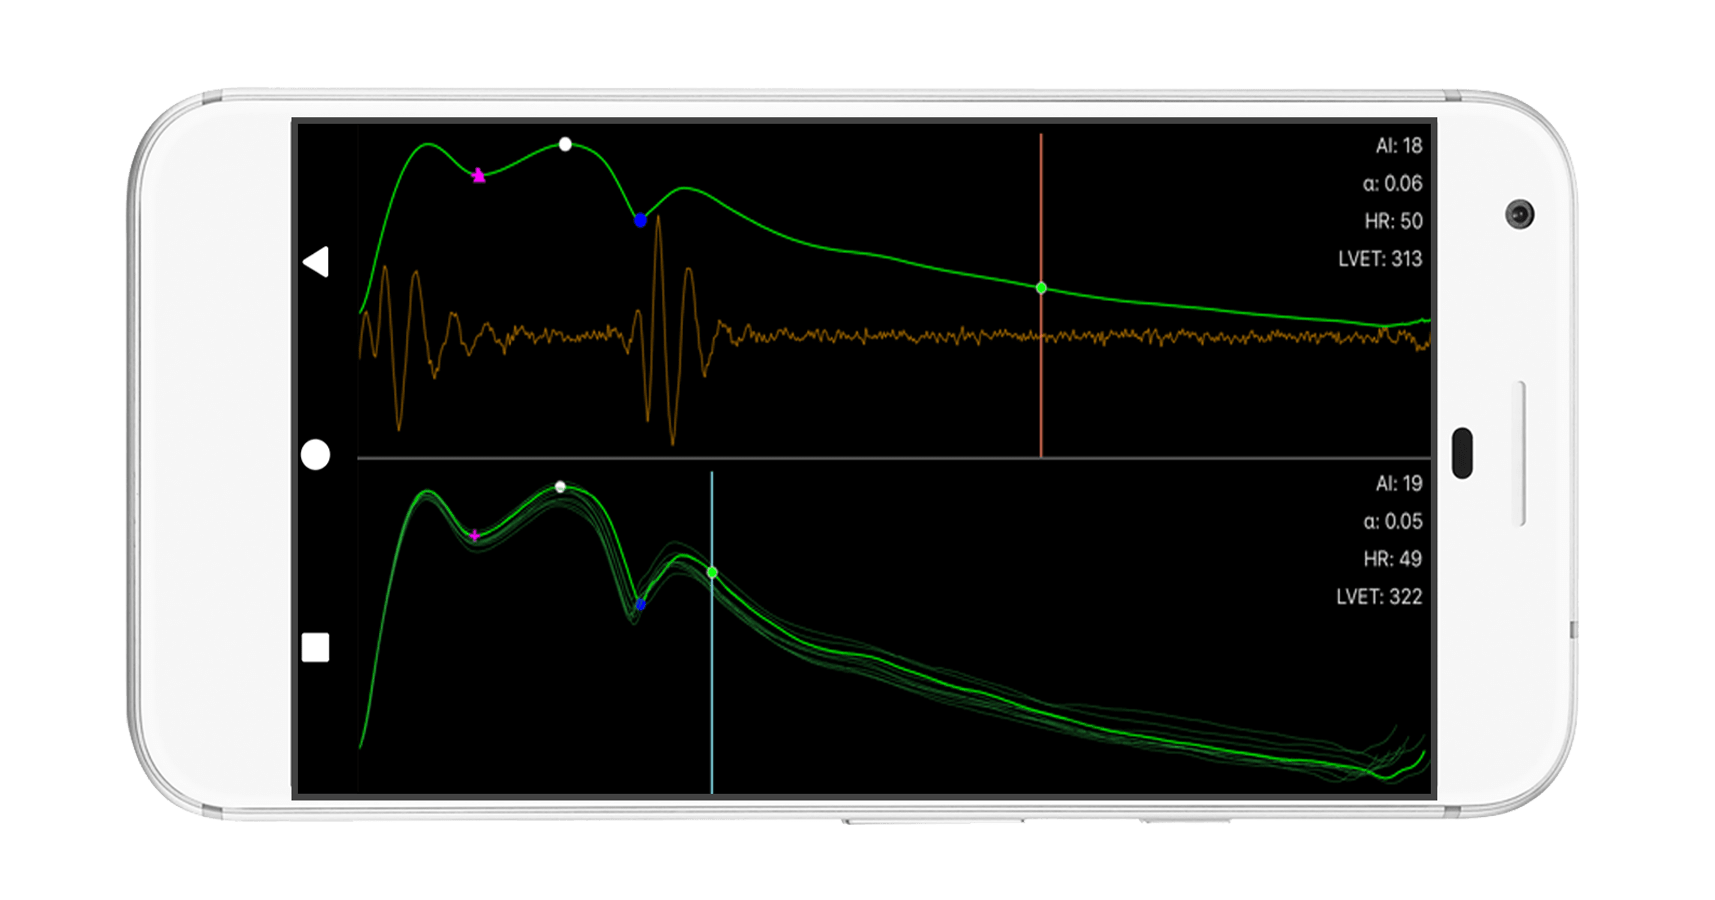
Read on to see how Avicena LLC used SciChart for Android to plot in real time their multi-series Cardiovascular Data for Medical Diagnostics.
Platform: iOS
Industry: Scientific & Medical Diagnostics
Avicena is a medical device company focused on providing critical information to patients and physicians through their mobile app which works in conjunction with their bespoke proprietary sensor platform the Vivio. The Vivio streams live cardiovascular data directly to a mobile device via Bluetooth to aid in Cardiovascular diagnosis.
Challenge: To display accurate Realtime, High-Bandwidth Cardiovascular data in up to 90 series streamed from their sensor device whilst maintaining a smooth UI and allowing for bespoke customizations and annotations.
Solution: Avicena used SciChart’s exceptional performance to render over a million data points at interactive frame rates whilst handling 90 series simultaneously. They utilised the extensive charting library to display data in in Lines, Bands and ECGs whilst creating a fully customized UI using our Rich Chart Annotations API.
