Read on to see how MTPredictor integrated SciChart into their Professional Charting Software program to deal with the complex data streams inherent to Financial Markets whilst maintaining an easy to use customer friendly interface and adding custom annotations.
Platform: WPF
Industry: Financial, Trading
MTPredictor was aiming to create a new iteration of their professional software package with a wide array of new custom features that maintained a smooth UI whilst delivering a rich user experience. The Charting solution needed to be able to handle multiple panels and display interactive annotations for analysis.
Challenge: To create a Fast and Reliable Visualization for Potential Trade Set up Analysis for Stocks, Futures and Forex Markets. Handling a multiple panel set up with interactive annotations for analysis with immersive features that allow their customers to gain a competitive edge.
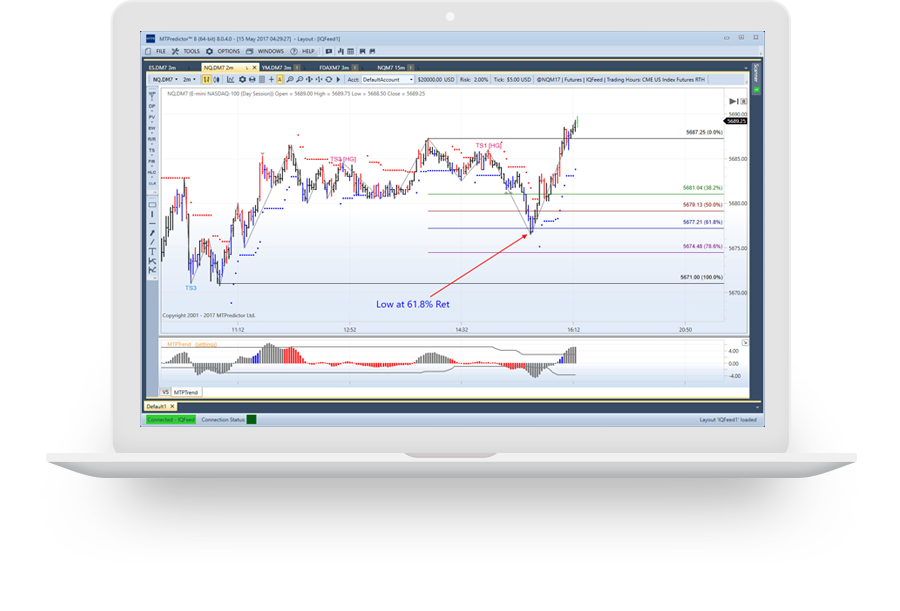
Solution: SciChart’s proven track record with complex financial market data was put to the test again and provided a fast, reliable & efficient charting solution. MTPredictor was able to handle large complex data-sets over multiple panels while maintaining a smooth user interface with Realtime updates. Advanced Tooltip drawing tools and indicator overlays were integrated into their Software depicting trade setup analysis features such as Elliot Wave Calculations and Fibonacci Retracements. A tabbed and stacked indicator panels were added below the main chart area for adding technical indicators to the chart. Charts were also enriched with easy “Grab and drag” annotations functionality.
