SciChart.js v6 in Alpha – WebGPU, Incredible Performance Gains and more
Our team has been working hard on continued R&D with SciChart.js – High Performance JavaScript Charts – and today we’d […]
SciChart is a High Performance, highly configurable cross-platform data visualisation SDK, catering to a variety of different platforms and sectors. We provide tools to visualise data on Windows (WPF Charts), native mobile (iOS Charts, Android Charts, macOS) and browser apps (Javascript Charts, Typescript, npm).
We’re proud to be the go to choice for Formula One, Nascar, Motorsport and the wider automative sector.
In one way or another, we now cater to every member of the F1 Grid, Nascar, the broader automative sector and a series of Motorsport Engineering feeder universities making SciChart, the preferred choice for handling huge volumes of Telemetry data, and more. If you work in motorsport or automative engineering, you’ve probably already used our charts and graphs, sometimes without even realising it. If you were studying in the last decade, then there is a good chance you used them in training too or learned about platforms leveraging us.
We’ve also been on hand to cater to F1 grid leading household names through our world-class software consultancy, specialising in high performance data visualisation and feature enhancement in a field where performance is important both on the track, and off it. Some of our projects in this sector have been running for multiple years allowing our F1 partners to succeed on the track.

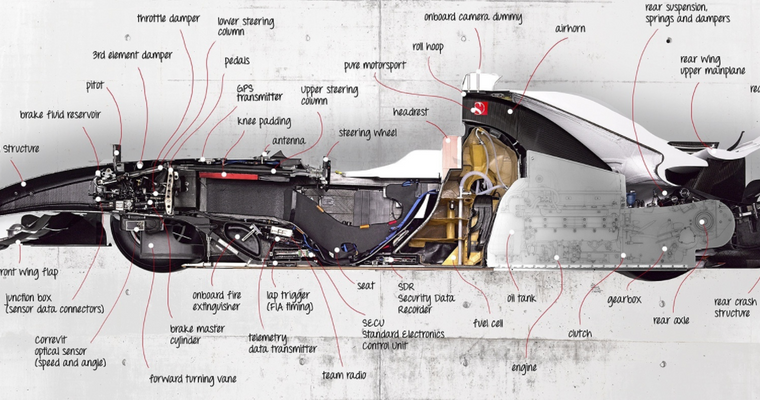
As a data visualisation SDK, our 2D & 3D charts and data visualisation solutions are embedded in software packages to be used by professional (and student) data analysts. In F1, Nascar and the Automative sector complex software packages are used to obtain, display and analyse data from control systems both in lap environments and open road settings. The electronic control unit (ECU) is a key part of modern vehicles that controls, processes and transmits the extensive amount of data from the car to the race team or automative analysts.
In F1, sensor inputs on the car are regularly in the thousands giving a hint as to the scale of the data to be visualised. In Nascar, this is often in the hundreds, but just as important. In commercial vehicles, the rigerous testing and design procedures can result in the same vast amounts of data to be analysed, requiring a robust data visualisation system.
In one F1 team, SciChart is the preferred choice and only data visualisation solution used in their record breaking proprietary Pit Strategy software
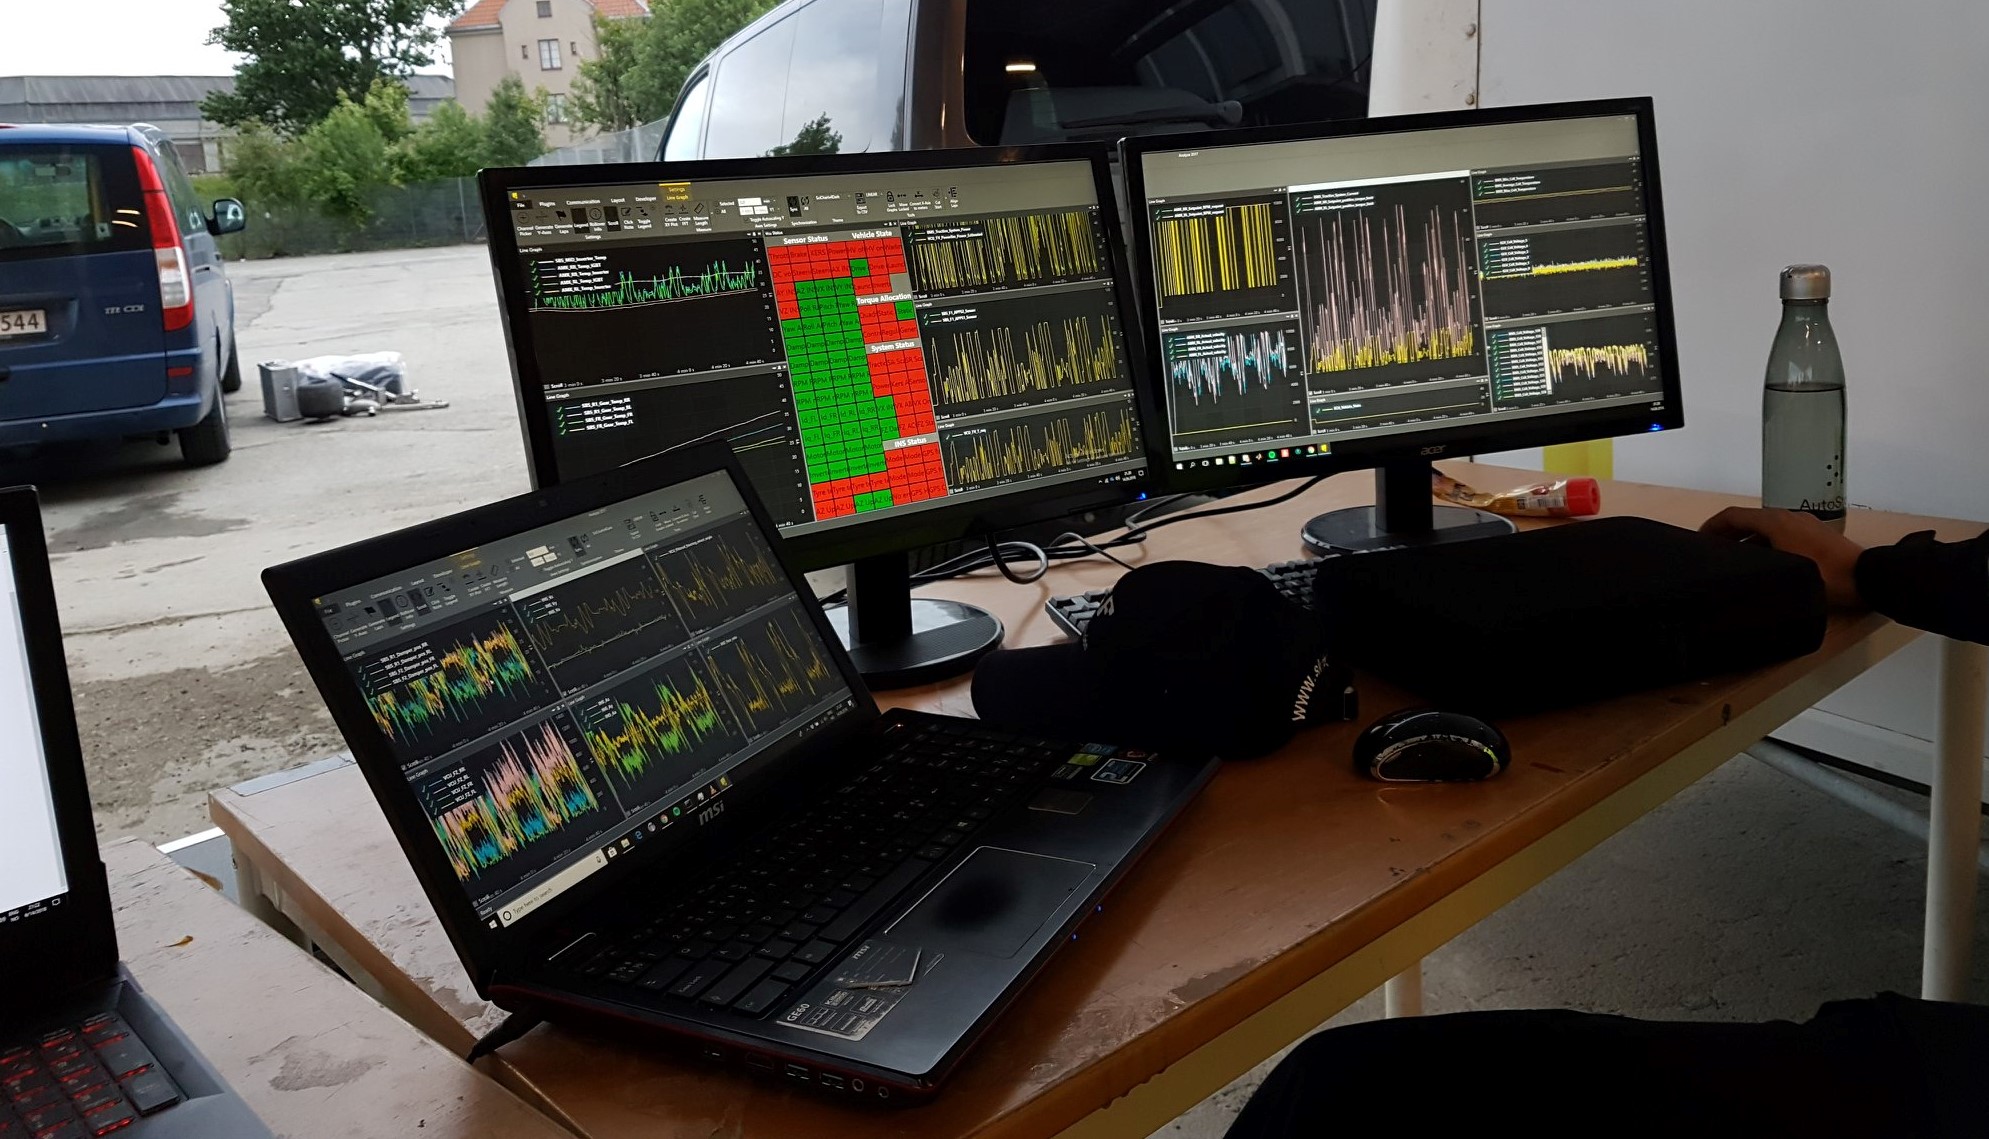
It’s here that SciChart is used and how we’ve established ourselves as the market leader in this sector. When performance is needed, we’ve been the go to option. We’re responsible for the smooth handling of data and complete the data journey which is initiated in precision data capture via sensors, processed with high integrity controllers and then passed to telemetics modules to offboard data to be processed and displayed by SciChart using our world-class solution. With such high quality information, in a deeply technical sector, the rigorous investigation of that data needs to be matched by a similarly world class data visualisation solution.
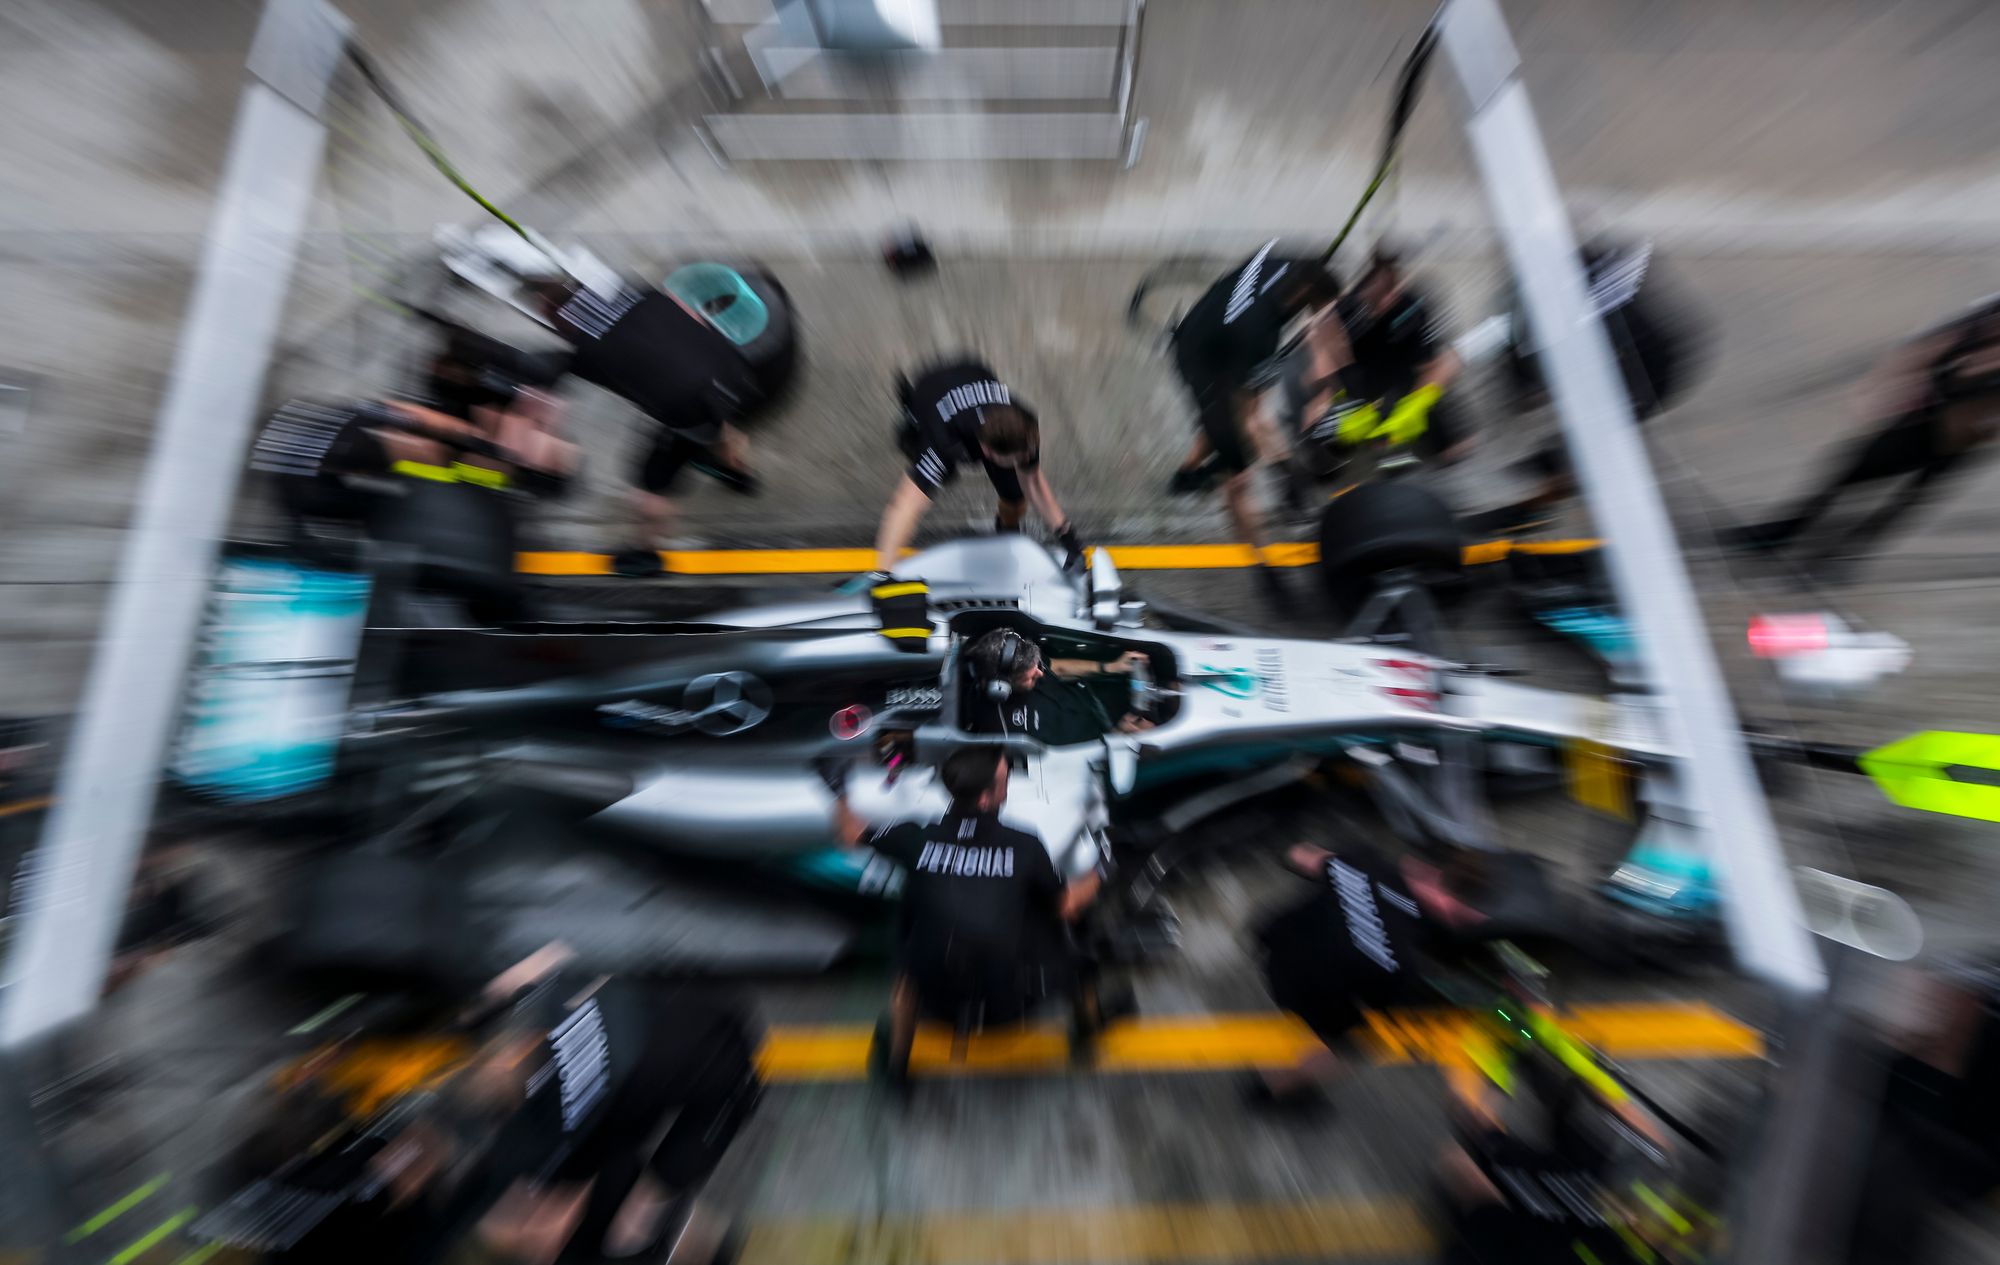
SciChart makes impossible projects possible, but on the track, we’ve worked extensively in several areas, and in certain cases, we’ve helped our F1 partners set world records and claw back seconds in the corners and in the pits.
The analytics toolsets including SciChart lie at the heart of decision making and design processes, allowing our customers to extract priceless insight from their products. This not only allows a deep understanding of performance and design, but also the ability to capitalise on it, customising the data output in a way geared to solving the issue at hand. This sensor output can be anything from monitoring the tyre temperatures, acceleration profile, RPM, driver response to G-forces or simply fuel economy in an open world setting.
SciChart allows you to convert the large amounts of high-rate data you have into meaningful charts, visualisations and actionable insights in a variety of ways when a one size fits all approach just wont cut it.
Performance is one feature we provide but flexibility is another. SciChart, unlike any other charting SDK on the market, is powered by an in house proprietary 3D rendering engine which leverages gaming technology to bring extreme performance to the data analytics field. Our rendering engine, code named Visual Xccelerator(TM) permits up to 100billion data points to be visualised on charts (Windows, WPF) but also gives you unparalled flexibility and the ability to work across platforms in a way that established SciChart as a genuine data visualisation ecosystem, not just a simple charting component.
In comparisons with standard charting components, we’re head and shoulders above the rest, outperforming all known competitors in the most complex test cases, sometimes by an order of magnitude or more.
To get into more detail though, it’s the customisability and stability that our customers have used to get their advantage. In a competitive field like motorsports, the in house knowledge is priceless and thats why the flexibility to curate sensor data is so important. SciChart enables not only custom chart types, multiple axis, complex dashboards but also overlaid algorithms, linked chart views and analysis tools. We’ve helped household names convert legacy C++ MFC applications, increasing performance and replaced entire in-house charts too. We’ve used our domain knowledge and our rendering engine to develop visualisation enhancements such as our GPU accelerated annotations & markers using our VX Engine, creating highly specific Axis and Series to load thousands of series without delay.
It’s one thing to collect all this data in realtime, it’s another to be able to visualise it in a meaningful way to extract information. Our customers know what they need to do and we provide the toolset to enable that. With the added flexibility of SciChart and the power of our Rendering Engine, we encourage new methedology and exploration of Data. Thats how you win with SciChart.
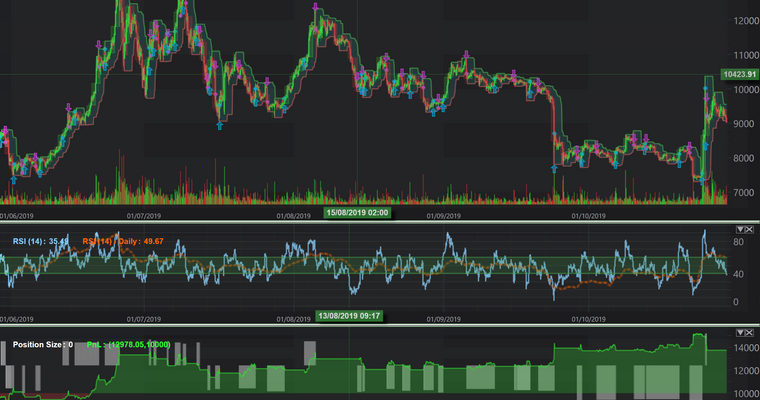
We work extensively in the Financial Trading sector, having our own Cryptocurrency trading application and it’s these cross sector skills that have enabled us to create a well rounded project. Those skills and expertise from fibonacci retracements, algorithmically programmed back-tested trading bots and synchronised charts, are also available when pouring over the data ouput of a $12million race car.
Even more important though is stability, we’ve built a solution based on our own rendering engine. With a shared code base leveraging expertise and knowledge in C++ we’ve ensured that SciChart is robust enough to withstand anything, and thats why you’ll not just find us handling race telemetry, but also rocket telemetry and analysing satellite orbits for over over 50% of Fortune 500 Aerospace companies.
No other company has the domain knowledge, and sector experience available at SciChart, and it shows in the products.
For obvious reasons, we’re not able to talk specifically about many things, however, we’ve helped Formula Student teams generate world class race strategy and deep analysis tools which they’ve been blogged about previously.
In the commercial sector, we’ve enabled our customers to break records, we’ve enabled the build out of complex pit stop strategy software where no other component has succeeded.
We’ve converted and upgraded legacy systems for entire race teams and we’ve used these skills again in Formula E and helped train the next generation of Data Analysts and Race Engineers.
We’ve also enabled off the shelf components, which are now synonymous with the sector. Where teams aren’t able to invest in their own products, they’ve leveraged the SciChart ecosystem in third party projects and helped push forwards not just F1, but Nascar and commercial vehicles. The optimisations that have come out of SciChart have trickled down into the retail market and we now see improved breaks, fuel consumption, fuel injection patterns and even improved tyres and mettelurgy.
If you have a project that looks impossible, get in touch and let us help you make it a reality.
Recent Blogs
![]()
Queens Award for Innovation
Proud winners of the Queens Award for Innovation, 2019. Awarded on account of our innovative graphics engine which underpins the SciChart library and enables our world-beating charting performance
![]()
National Business Awards
Highly Commended for Lloyds National Business Awards, 2019. Awarded on account of our innovative graphics engine and impressive customer base
![]()
National Technology Awards
Awarded “Healthcare Tech of the Year” at the 2025 National Technology Awards – a top UK recognition for breakthrough innovation in technology.

Reviews
SciChart has received hundreds of verified, 3rd party reviews