SciChart® the market leader in Fast WPF Charts, WPF 3D Charts, iOS Chart, Android Chart and JavaScript Chart Components
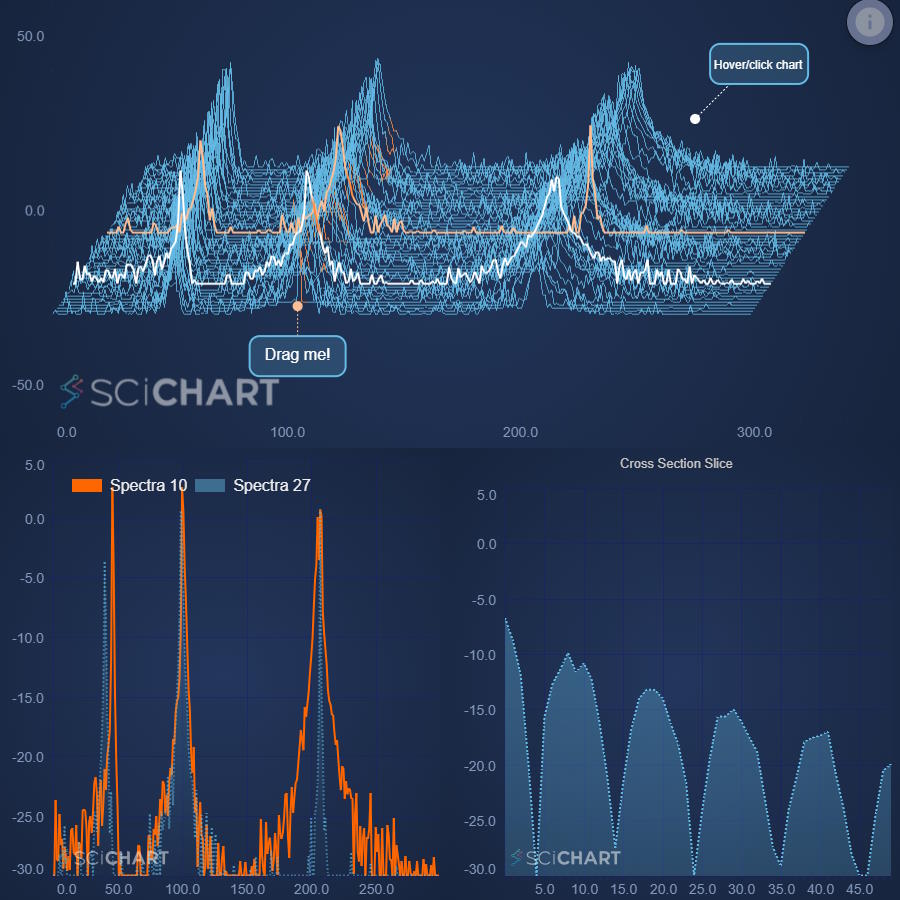
SciChart.js is a powerful, feature-rich, High Performance JavaScript chart library. Used in Business, Scientific, Medical, and Financial apps.
Using WebGL & WebAssembly and with 40 2D & 3D Chart types, find out why our JavaScript Charts are rated 5-Stars!
Create dynamic, interactive JavaScript charts, with blistering real-time WebGL and WebAssembly performance. Plus incredible flexibility and depth of features.
With SciChart.js you can create JavaScript or TypeScript apps plot many millions of data-points, or thousands of chart series and still zoom, pan and update interactively.
Powered by our proprietary, award-winning WebGL & WebAssembly rendering engine, our JavaScript chart library enables next-generation Big Data apps with dynamic, interactive charts that will delight your users.
SciChart.js is built for rich interactive charts! With our JavaScript charts you can add drag-to-zoom, pan, mousewheel zoom, drag axis to zoom or zoom extents behaviours with our powerful ChartModifier API
Custom actions are also possible with our rich ChartModifier API, where you can override mouse clicks or gestures and create custom panning, zooming or user interactions
SciChart.js supports multiple types of animations to make impressive dashboards and browser applications which will delight your users.
Add series animations which execute when a chart type is shown. Data animations morph or animate from one dataset to another. Style Animations - allow you to animate style (line/fill colour, line thickness) from one set of properties to another.
Our JavaScript Chart library features rich cursors & tooltips out of the box, which are built on our powerful ChartModifier API
Choose from built-in Cursors, Crosshairs, Tooltips on mouse/touch or Rollover (showing vertical lines) as well as Legends. Decide what information is presented in a tooltip. Style tooltips to fit your application.
Our JavaScript Chart library features a powerful Annotations API which allows you to overlay Line, Text, Boxes, Shapes or Watermarks over the chart, at specific X/Y data locations. Annotations update position as you zoom or pan the chart.
SciChart.js supports draggable vertical/horizontal line annotations to mark thresholds or time stamps. Finally, Custom annotations are possible to display custom shapes or points of interest.
SciChart.js features several themes out of the box, including Light Theme and Dark Theme. SciChart supports building Custom Themes either inheriting our own or completely bespoke.
Our charts support transparent background, image background, blurred or glass effect background. Style SciChart to fit your application and delight your users!
SciChart.js features multiple axis types out of the box, including Numeric Axis, Category Axis (Stock Chart axis) and Logarithmic Axis.
Format labels as Dates, numbers, strings (text) or images. Multi-line text labels and rotated axis labels are supported. Full control over axis label format, label style and label / gridline interval is possible with SciChart.js. The flexibility of our JavaScript charts are second to none.
Unlike other JavaScript Charts that only support a single X and Y axis, SciChart.js supports unlimited, multiple X & Y Axis.
You can scale series independently, have left, right, top or bottom axis. You can scale axis independently
Popular in the Oil & Gas industry, SciChart.js supports vertical or rotated charts. Set a YAxis alignment to the left, and XAxis alignment to the top, and this will rotate a chart 90 degrees.
All the zooming and panning is now vertical. You can scroll the chart vertically, and use tooltips and legends and more.
SciChart.js features serles selection and hover events on click. We've also packaged a Chart Modifier which will apply selected or hovered series styling to the chart.
Get notified when a user clicks on a chart series. Use this to perform visual-feedback of selection or chart drill-down, making for compelling interactive browser apps.
SciChart.js also supports data-point selection by clicking or dragging a rectangle on the chart.
Get notified when a user clicks a data-point by events and callbacks. Use this to update the selection visual and create an extra layer of interaction to data-driven apps.
With SciChart.js you can colour data-points based on a rule e.g. would you like all data-points with value > 10 to be coloured red? With our PaletteProvider API you can do this.
Colour volume bars in a stock chart red or green based on up or down, dynamically style data-points or sections of the chart based on thresholds, custom objects and more.
SciChart.js supports dynamic, real-time Candlestick and Ohlc charts. Connect our charts to real-time exchange data and they can tick & update in real-time. Our performance is second-to-none making SciChart.js perfect for financial stock chart apps.
Another stock-chart related feature, we've added a Scrolling Overview control to the SciChart.js library. This allows you to see a history of the entire chart data and scroll back & forth instantly. Perfect for financial & stock chart apps!
With SciChart.js you can link multiple charts. Synchronize Zooming and Panning across charts. Have a single tooltip shared across chart surfaces. Create multi-pane stock charts with technical indicators.
Plus, with support for hundreds of WebGL powered charts on a single webpage, you won't get caught short running out of WebGL contexts or experience slow performance with SciChart.
SciChart.js features a filters and data-transforms API. Add moving averages, linear trendlines to a chart. Scale and Offset a series. Calculate the ratio between two series.
All SciChart's filters update dynamically as the underlying data updates. What's more, you can create custom filters to transform your data dynamically and on the fly.
Another API - the Builder API - allows you to create chart definitions with JSON or JavaScript objects. It's never before been easier to create JavaScript charts with SciChart.js. Define your charts on the server, or in a re-usable React component and share them throughout your app.
With SciChart.js every type is JSON Serializable, so you can now create entire chart definitions server-side out of JSON objects and rehydrate them on the client. Save/load chart settings to JSON, allowing rich, dynamic apps with our powerful JavaScript Chart library
We've build Accessibility hooks into SciChart.js making it suitable for enterprise-grade applications.
Accessibility features include Voiceover (text to speech for chart parts), Theming, Scaling of fonts with Browser zoom / DPI. color and contrast, and keyboard interaction on the chart.
With SciChart.js you can plot 3D Scientific Charts such as this 3D Surface Mesh (3D Mountain or Area chart), 3D Bubble, Scatter or point-cloud.
With the help of our cross-platform Visual Xccelerator 3D engine you can plot scientific surface mesh charts in real-time with tens of thousands of cells JavaScript and TypeScript applications.
Our 3D Scatter / Bubble and Point-cloud chart types allow you to plot 3-dimensional data with XYZ points.
For the first time you can use our powerful JavaScript 3D Chart library to visualise point-cloud outputs from LIDAR, UAV, self-driving car sensors, or plot the relationship between values in scientific, machine learning or statistical data with 3 or 4 (XYZ, Color) or 5 (XYZ, Color, Size) dimensions.
SciChart.js features multiple axis types out of the box, including Numeric Axis, Category Axis (Stock Chart axis) and Logarithmic Axis.
Format labels as Dates, numbers, strings (text) or images. Multi-line text labels and rotated axis labels are supported. Full control over axis label format, label style and label / gridline interval is possible with SciChart.js. The flexibility of our JavaScript charts are second to none.
With Open Source JavaScript Charts you may find yourself stuck without technical support if something goes wrong. SciChart provides enterprise grade technical support which has been 5-Star Rated for many years.
Many competitors have a limit of support, but we provide 1-year unlimited technical support and latest-version updates (subject to fair use policy) to all our customers. Our customers find our tech-support to be a huge time & money saver. If you want to build excellent quality projects, build them quickly and solve problems when they occur, choose SciChart.js
SciChart provides native, high performance chart controls on four platforms: Android (Java, Kotlin), iOS and macOS (Objective-C, Swift), Xamarin (C#), Windows (WPF C#) and Web (JavaScript/TypeScript). For the best realtime charting component with cross platform support, choose SciChart. .
SciChart.js has a loaf of API hooks allowing you to extend, customize or otherwise bend the chart control to your will. Developers love our flexible, and powerful API!
You are in control not only of a text formatting but changing the axis labels into a custom labels e.g. strings, prefix, suffix, scientific notation, label rotation, image labels and more.
Allows per point coloring of a series based on data value. E.g. if you want a line to be red if over a certain value? That can easily be done with the palette provider.
Define a chart definition as a JavaScript object or JSON and share it across screens. Create client/server apps by defining the chart server-side and displaying on the client
Allows creation of behaviour modifiers which can be attached to the chart. Update the chart data, custom zooming panning, custom tooltip actions? You can customize anything in SciChart.js with this rich, powerful API
SciChart.js is designed for ease of use. We've included sets of video tutorials, over 40 code examples and hundreds of hand-written documentation pages to ensure that you can get to work with minimum of time spent.
SciChart.js JavaScript Charts are licensed on a perpetual, per-developer licensing model, with in most cases OEM-free rights for distribution. Our commercial licenses come with 1-year priority tech support and updates. SciChart's chart library is trusted by thousands of customers including top names in Medical, Defence, Automotive, F1, Scientific, Pharma and Business.