So a lot of people are checking out the SciChart v4 BETA. That’s great! Except, of those who contacted us, no-one seemed to be aware that we’ve actually created a tool to help you migrate from v3.x to v4.x. This could save you a *lot* of time as there are significant API changes in the SciChart v4 SDK. The following is a guide to help you upgrade quickly from v3.x to v4.x.
Upgrading from v3.x of SciChart WPF to v4
At SciChart we follow Semantic Versioning. This means that major version changes (v3, v4, v5) have breaking API changes and will require changes to your project to compile. Minor versions (e.g. v3.3, v3.4) or patches (v3.4.1, v3.4.2) should be backward compatible drop-in replacements.
Since v4.x has major API changes, we have built a tool to help you do the bulk of the update. This is the SciChart.UpdaterTool!
Installing the SciChart.UpdaterTool (Visual Studio 2012, 2013, 2015)
The SciChart Updater Tool is now available as a Visual Studio add-in via the Visual Studio gallery. To download and install it, go to Tools -> Extensions and Updates and search for ‘SciChart.UpdaterTool’ in the Visual Studio Gallery.
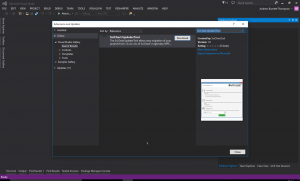
After installation you will need to restart Visual Studio. The SciChart.UpdaterTool should now be available via the Tools menu in Visual Studio.
Installing the SciChart.UpdaterTool (Visual Studio 2010)
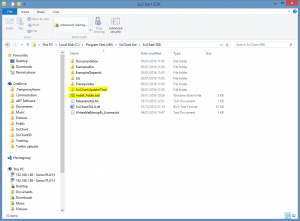
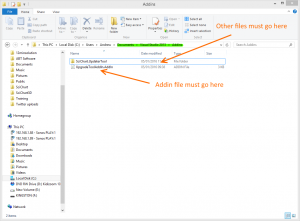
The SciChart UpdaterTool is copied to the Install directory when you install SciChart v4.x from the MSI Installer. This basically copies the contents of the %InstallDir%/SciChart.UpdaterTool to %CurrentUser%/Documents/Visual Studio/Addins
If for any reason this fails, you can try running the Install_Addin.bat batch file manually, or, copying the SciChart.UpdaterTool files over to %CurrentUser%/Documents/Visual Studio/Addins manually.
Using the SciChart.UpdaterTool
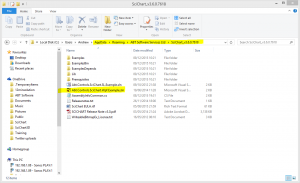
As a tutorial, we are going to update the Examples from v3.6 of SciChart to use v4.x with the updater tool. To follow the tutorial, open the Abt.Controls.SciChart.Wpf.Example.sln, or, use your own Visual Studio solution which references v3.x of SciChart.
Starting the SciChart.UpdaterTool
To start the SciChart.UpdaterTool, after opening a Visual Studio project which uses SciChart v3.x go to Tools -> SciChart Updater.
Note: If the SciChart Updater addin is not available, go back to step #1 and run the Install_Addin.bat batch file.
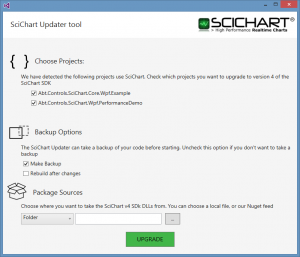
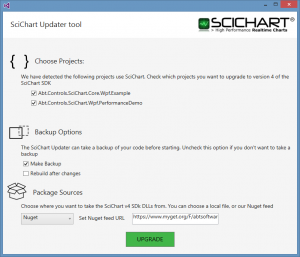
This should start the updater GUI
- Choose your projects to update. By default the updater chooses all projects which reference SciChart. If you do not see any projects here, then either your project does not reference SciChart, or, another problem has occurred.
- By default the SciChart Updater Tool creates a backup of your files. You can deselect this option if you are operating under version control.
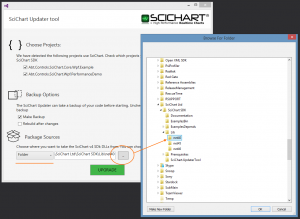
- You need to choose the Package sources. This can be a local file / folder or NuGet feed.
Updating from local DLL files
To update your project referencing local DLL files, select ‘Folder’ as the package source, and navigate to the directory where SciChart v4 DLLs are installed. By default, this is C:Program Files (x86)SciChart LtdSciChart SDKLibnet40 (for .NET4.0).
Updating from NuGet feed
To update your project referencing our packages from NuGet, select ‘NuGet’ as the package source, and check the NuGet feed. This should be https://www.myget.org/F/abtsoftware/api/v2 for Visual Studio 2012, 2013, and https://www.myget.org/F/abtsoftware/api/v3/index.json for Visual Studio 2015.
Running the SciChart Updater Tool
We’re going to run ours from installed-files. So, selecting the SciChart DLL folder, hit the ‘Upgrade’ button.
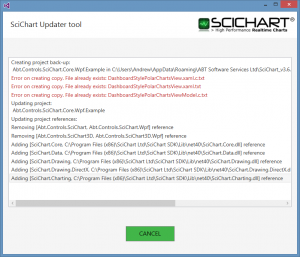
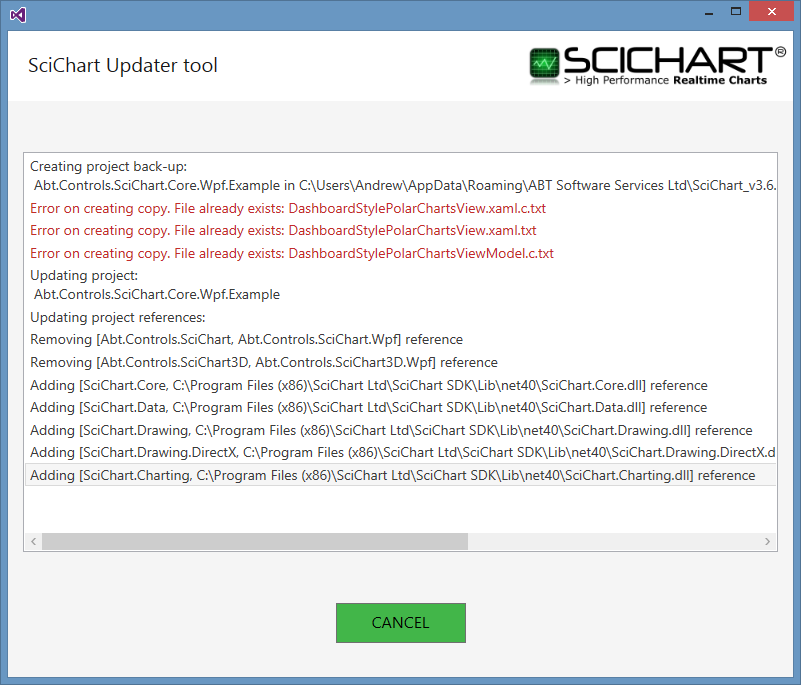
The updater should start. It may output some warnings at the start (if you have a previous backup). These can be ignored.
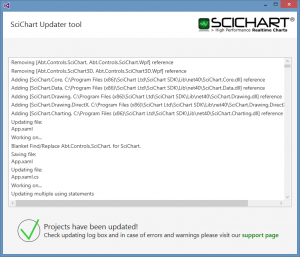
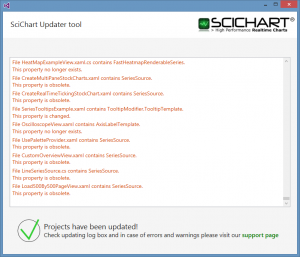
The updater then reports on files being upgraded.
Finally, warnings are shown at the end of the process, once the update has completed.
Fixing Build Errors after using SciChart.UpdaterTool
The SciChart.UpdaterTool unfortunately doesn’t do all the work (it does do about 90%!). The last few steps are manual.
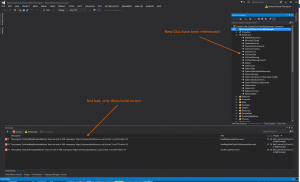
We can start by building our project and seeing what errors occur. Also, what warnings were output by the SciChart.UpdaterTool.
Build Error: The property ‘FastHeatMapRenderableSeries’ does not exist in XML namespace ‘http://schemas.abtsoftware.co.uk/scichart’
This error occurs because of an API Change to HeatmapColorMap. The HeatmapColorMap.FastHeatmapRenderableSeries property is deprecated and has been removed.
To upgrade your code, please do the following.
Before
<s:HeatmapColourMap Margin="30" HorizontalAlignment="Left" VerticalAlignment="Top" FastHeatMapRenderableSeries="{Binding ElementName=heatmapSeries}" Opacity="0.8" Orientation="Vertical" />
After
<s:HeatmapColourMap Margin="30"
                    HorizontalAlignment="Left"
                    VerticalAlignment="Top"
                    ColorMap="{Binding ElementName=heatmapSeries, Path=ColorMap}"
                    Minimum="{Binding ElementName=heatmapSeries, Path=Minimum}"
                    Maximum="{Binding ElementName=heatmapSeries, Path=Maximum}"
                    Opacity="0.8"
                    Orientation="Vertical" />
Build Error: The property ‘AxisLabelTemplateSelector’ does not exist in XML namespace ‘http://schemas.abtsoftware.co.uk/scichart’
This error occurs because of changes to the CursorModifier. We no longer use AxisLabelTemplateSelectors to change axis labels on a per-axis type basis, but instead, have an attached property which is placed on the axis.
For now, we will simply remove this attribute temporarily.
To put it back, please see the updated documentation about the CursorModifier AxisLabelTemplate Attached Property.
Build Error: The type or namespace name ‘PaletteProviderBase’ could not be found (are you missing a using directive or an assembly reference?)
SciChart.UpdaterTool also reports this as a warning: File RedIfOverThresholdPaletteProvider.cs contains PaletteProviderBase. This class no longer exists.
From v3.x to v4.x PaletteProviderBase, IPaletteProvider have been significantly refactored. You will need to adjust your PaletteProvider implementations following the updated documentation for PaletteProviders in v4.
As a quick guideline, there is no longer a base-class for PaletteProividers, and the base interface IPaletteProvider has only one method on it. To implement a new palette provider, you may need to implement the following interfaces:
- IStrokePaletteProvider: for lines, and series which have a stroke
- IFillPaletteProvider: for series which have a fill
- IPointMarkerPaletteProvider: for series which have a point-marker
Example: RedIfOverThresholdPaletteProvider
Before
using SciChart.Charting.ChartModifiers;
using SciChart.Charting.Visuals.RenderableSeries;
using SciChart.Charting.Numerics;
using System;
using System.Windows.Media;
using SciChart.Charting.Model.DataSeries;

namespace SciChart.Example.Examples.IWantTo.AnnotateAChart.DragHorizontalThreshold
{
    /// <summary>
    /// Defines a paletter provider to return a red color if the Y-Value is over a threshold value
    /// </summary>
    public class RedIfOverThresholdPaletteProvider : PaletteProviderBase
    {
        public double Threshold { get; set; }

        public override Color? GetColor(IRenderableSeries series, double xValue, double yValue)
        {
            if (yValue > Threshold)
                return Color.FromArgb(0xFF, 0xFF, 0x33, 0x33);

            // Returning null means use the default color when rendering
            return null;
        }
    }
}
After
using SciChart.Charting.Visuals.RenderableSeries;
using System.Windows.Media;
using SciChart.Charting.Model.DataSeries;
using SciChart.Charting.Visuals.PaletteProviders;

namespace SciChart.Example.Examples.IWantTo.AnnotateAChart.DragHorizontalThreshold
{
    /// <summary>
    /// Defines a paletter provider to return a red color if the Y-Value is over a threshold value
    /// </summary>
    public class RedIfOverThresholdPaletteProvider : IStrokePaletteProvider, IFillPaletteProvider
    {
        private XyDataSeries<double, double> _xyData;
        public double Threshold { get; set; }

        private Color? GetColor(IRenderableSeries series, double xValue, double yValue)
        {
            if (yValue > Threshold)
                return Color.FromArgb(0xFF, 0xFF, 0x33, 0x33);

            // Returning null means use the default color when rendering
            return null;
        }

        public void OnBeginSeriesDraw(IRenderableSeries series)
        {
            // Do nothing. Can be used to reset fields before a draw
            // For performance, we also recommend getting, casting and caching a DataSeries here, e.g.
            _xyData = series.DataSeries as XyDataSeries<double, double>;
        }

        public Brush OverrideFillBrush(IRenderableSeries series, int index, IPointMetadata metadata)
        {
            // PaletteProviders now pass in the series + index to data. You can get the data out as follows
            var color = GetColor(series, _xyData.XValues[index], _xyData.YValues[index]);
            if (color.HasValue)
                return new SolidColorBrush(color.Value); // Note: Caching brushes is advisable

            return null;
        }

        public Color? OverrideStrokeColor(IRenderableSeries series, int index, IPointMetadata metadata)
        {
            // PaletteProviders now pass in the series + index to data. You can get the data out as follows:
            var color = GetColor(series, _xyData.XValues[index], _xyData.YValues[index]);
            return color;
        }
    }
}
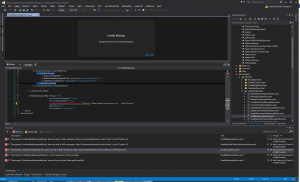
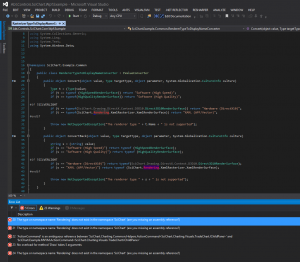
Build Error: The type or namespace name ‘Rendering’ does not exist in the namespace ‘SciChart’ (are you missing an assembly reference?)
This build error should only affects the upgrade of SciChart Examples solution from v3.x to v4.x, e.g. you should not see this when you update your own projects. For the purpose of the tutorial, to fix this, we remove the fully qualified namespace.
Before
After
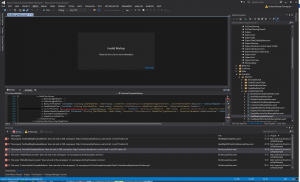
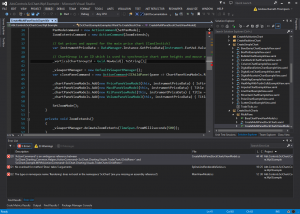
Build Error: ‘ActionCommand’ is an ambiguous reference between ActionCommand …
This build error should only affects the upgrade of SciChart Examples solution from v3.x to v4.x, e.g. you should not see this when you update your own projects. For the purpose of the tutorial, to fix this, we simply specify the fully qualified namespace
Before
After
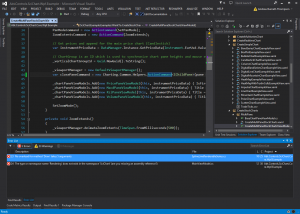
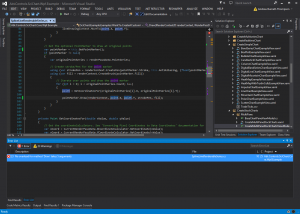
Build Error: No overload for method ‘Draw’ takes 5 arguments
There have been significant changes to the PointMarker API. You may see this build error if you have a custom PointMarker derived type, or have built a CustomRenderableSeries.
To fix it, please do something like the following:
Before
After
Fixing Warnings Output by SciChart.UpdaterTool
A number of warnings may also be output by the SciChart.UpdaterTool. Here we review these.
Warning: File ChartTypeViewModel.cs contains SeriesSource. This property is obsolete.
The SciChartSurface.SeriesSource property has been made obsolete, but backward compatible. Your application will still continue to work with it, but we strongly recommend upgrading to the new SeriesBinding MVVM API provided with SciChart v4.x, as the old SeriesSource API will no longer be supported.
Warning: File RedIfOverThresholdPaletteProvider.cs contains PaletteProviderBase. This class no longer exists.
We have addressed how to resolve this in Section 2.4.3.3, by using the updated PaletteProvider API.
Completing the SciChart.UpdaterTool Tutorial
If you have followed the tutorial to update the SciChart WPF Examples from v3.x to v4.x, you should now be able to build and run the SciChart WPF Examples Suite (for v3) but referencing v4.x DLLs!
Related Posts
