This is a private document where we’re going to detail the SciChart v4 roadmap. We don’t like to make this information public as it can negatively impact our business, plus contains information that could be useful to competitors. So, please keep it confidential within your organisation.
I’m sure you are all wondering what we have been working on while continuing to deliver maintenance updates to SciChart v3.x! Well, here is our current (in-progress) and future (planned) roadmap for the next year.
Enjoy!f
Features In Progress
The following features are in progress now and scheduled for release for the end of the year. We don’t have an exact release date, but once the package is ready, we will be sending out a BETA to interested customers and shortly afterwards a full release.
SciChart v4 SDK
PointMetadata Feature
Ability to tag any object onto an X-Y data-point e.g. dataSeries.Append(xValue, yValue, new AnyClass())
PointMetadata will be optional to preserve performance when it is not needed
Point Metadata object to appear in tooltips, hit-test and be passed to PaletteProvider
We are looking at ways of improving the PaletteProvider API to allow passing PointMetadata classes and Data-Point indices through to the PaletteProvider
Export to Vector format (XPS) and High Resolution printing
A customer of ours is considering feature-sponsoring the ability to export to Vector and allow the output to be scaled up or down with no loss of quality.
Part of this work is proprietary but part (ability to output XPS Vector format from SciChart) will be included in the base SciChart library.
Is there anything else we’ve missed? People email us all the time with feature requests and we store them in a task tracker. We’ve captured the most frequently requested above.
SciChart 3D WPF
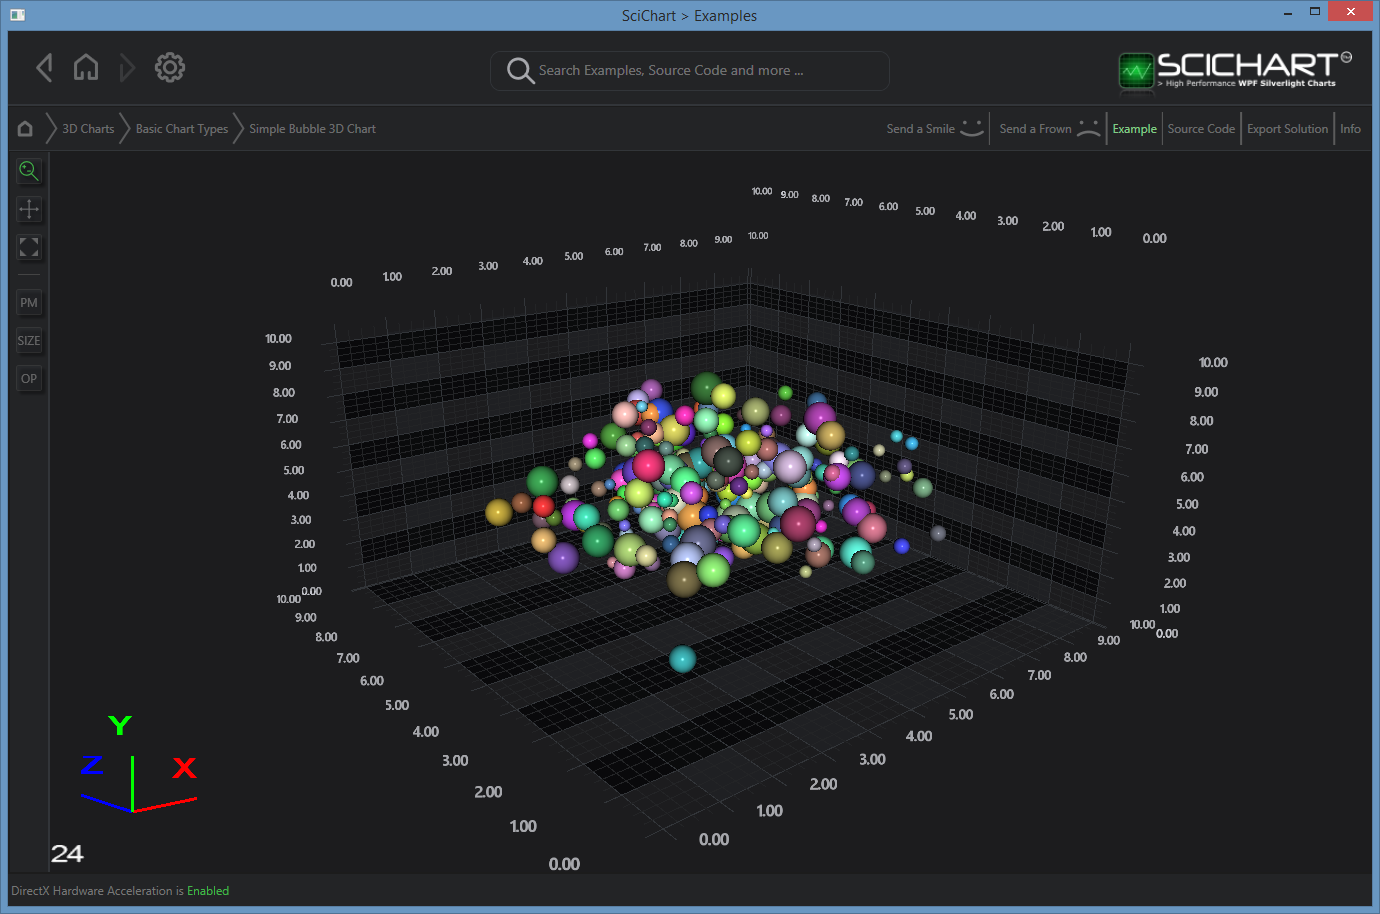
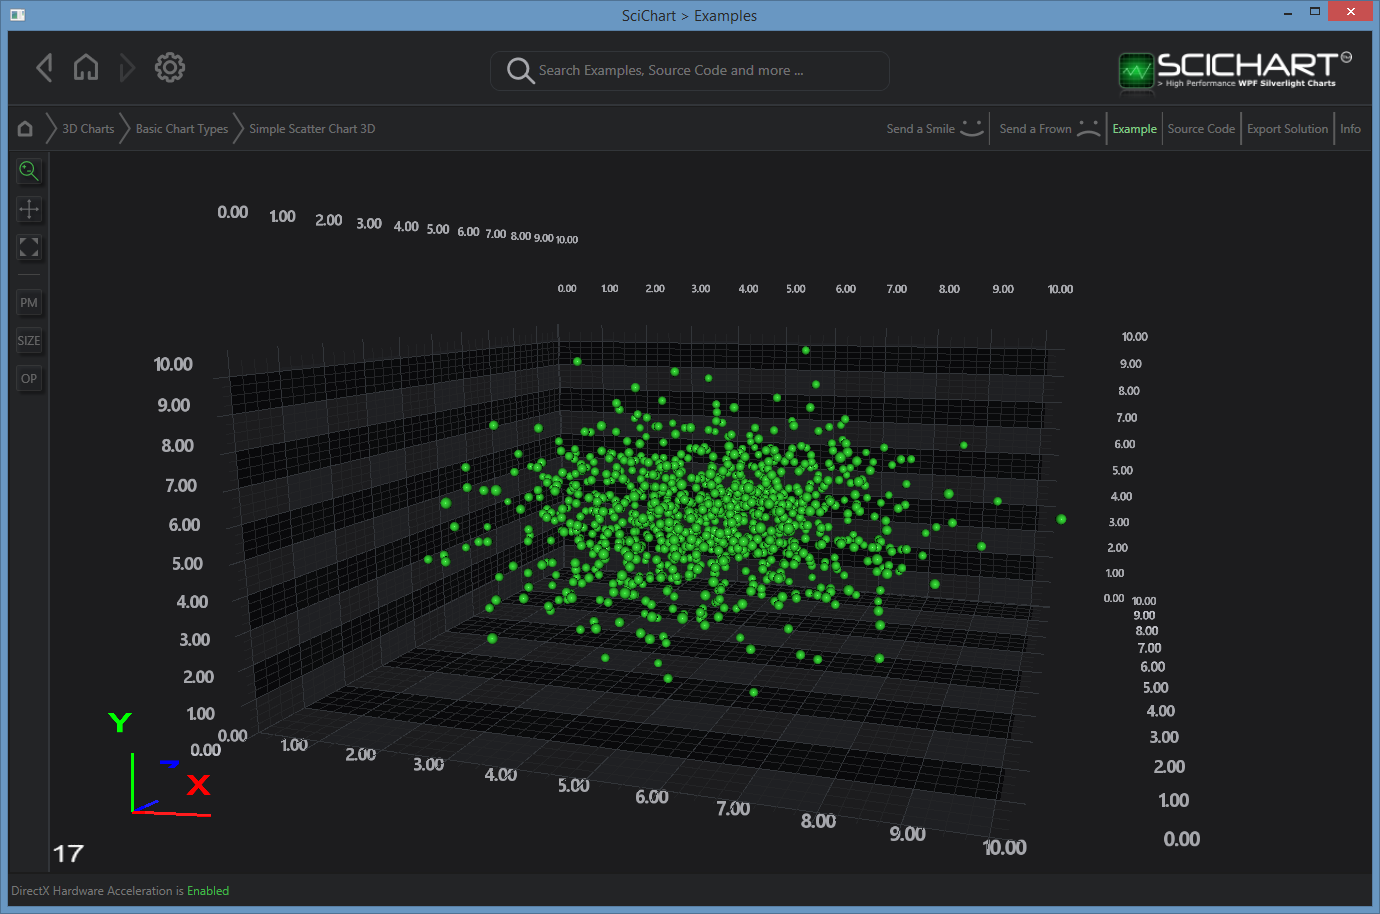
Over the past year we have been developing a 3D Chart component for SciChart WPF. The SciChart 3D project focusses on the main scientific 3D chart types, including:
SciChart3D will feature vertex selection (point-click multi-select), orbit/zoom/pan ChartModifiers, tooltips and a familiar API with the similar SciChart3DSurface, RenderableSeries3D, DataSeries3D, NumericAxis3D, ChartModifiers, LabelProviders types that you have come to know (and love!) in SciChart.
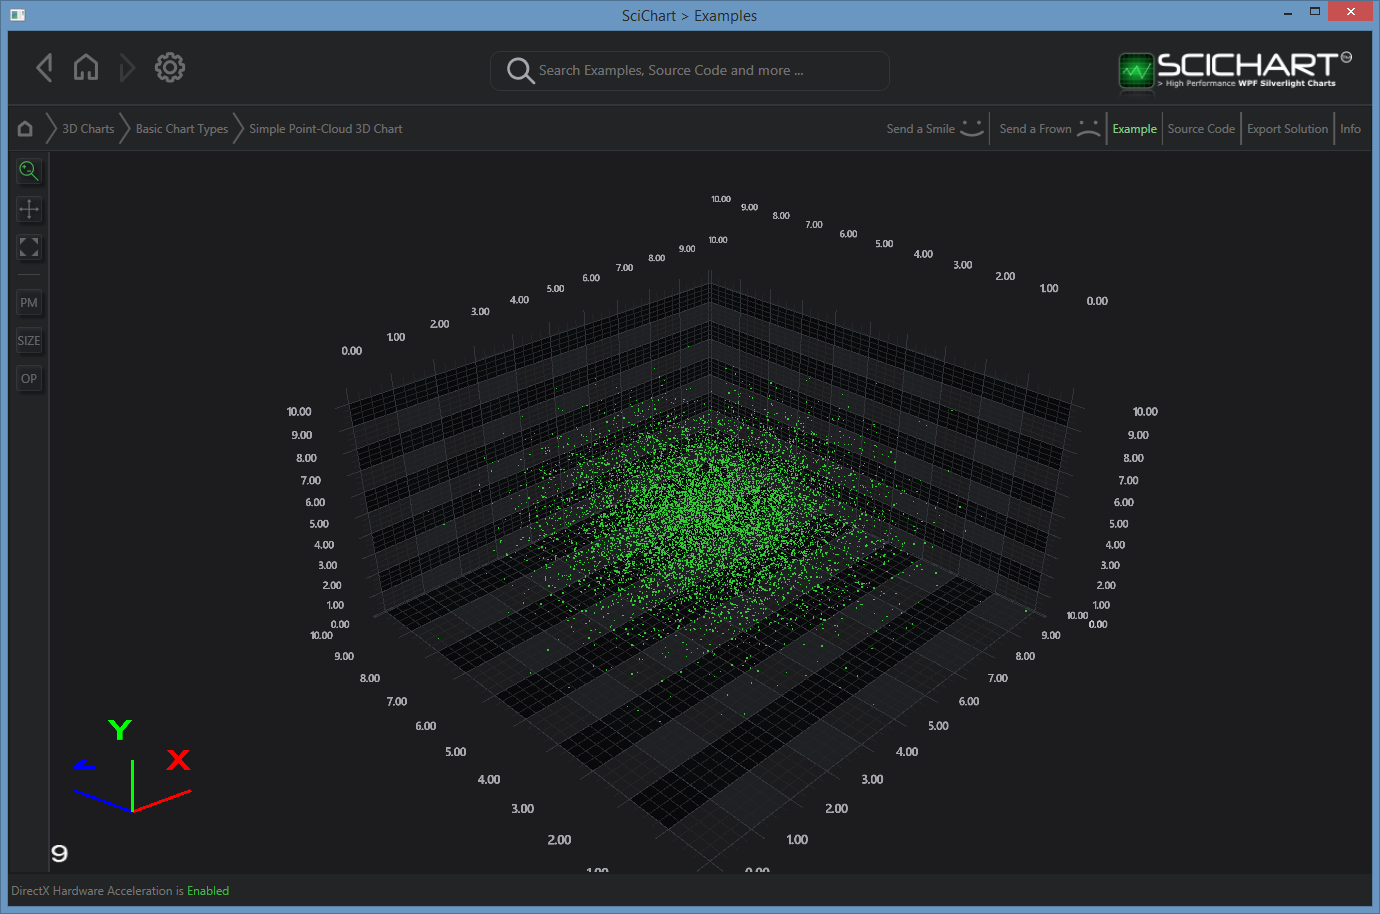
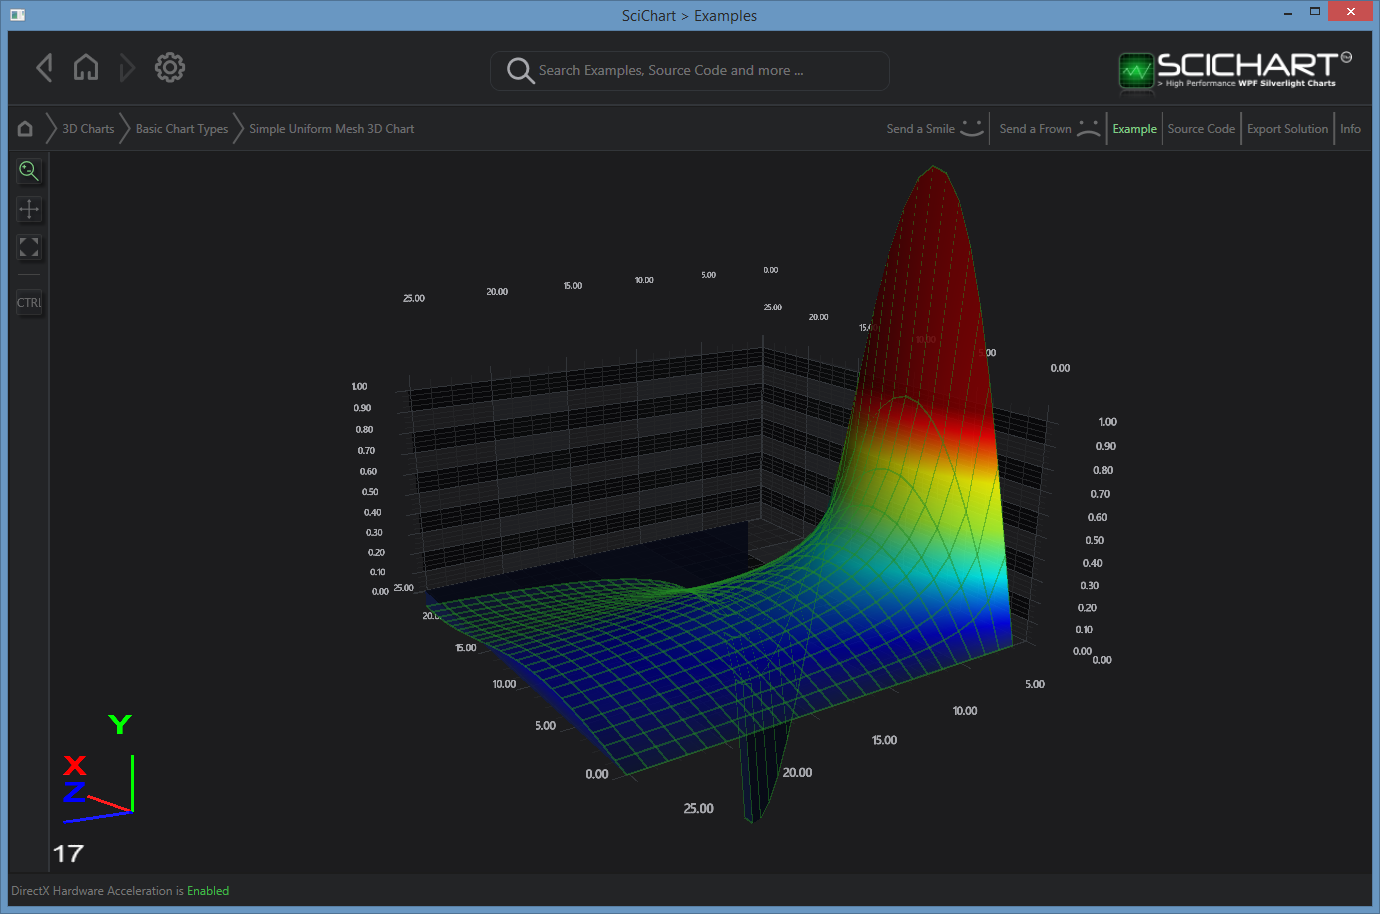
3D Bubble Chart with individual point colouring & size3D Point Cloud allowing high performance NBody simulations3D Scatter with individual point-colouring3d Uniform Surface Mesh with optional wireframe and a range of paletting options
We have been working on performance of SciChart3D, after all, we are making a scientific chart!
Uniform Surface Mesh
will be limited to the maximum texture size in DirectX10, which is 16,000 x 16,000 cells.
Practically speaking, 2,000 x 2,000 will be real-time and 10,000 x 10,000 will allow for static charts to be generated.
The dataseries API for Uniform Surface Mesh will allow for realtime update of rows, single cells or the entire mesh, so it will be possible to achieve ‘scrolling surfaces’ or heatmaps.
3D Point Cloud charts
will be able to render 1,000,000 points at interactive framerates.
Heatmap / Spectrogram
will basically be a Uniform Surface Mesh with a camera looking down from above.
Therefore, the new heatmap will be able to support similar numbers to surface mesh.
Cell sizes of 2,000 x 2,000 should be interactive and real-time.
All chart-types
Resampling is not really possible in 3D so instead, we will be employing caching techniques, e.g. regenerating the model only when the data changes.
Thus static models will allow for very high point counts to be rendered, whereas dynamic models will allow fewer points, but we will still focus on performance for both the static and dynamic cases.
We anticipate that SciChart3D will be ready for release around the same time as SciChart v4 SDK, in fact, 3D depends on v4 so they must go out the door at approximately the same time!
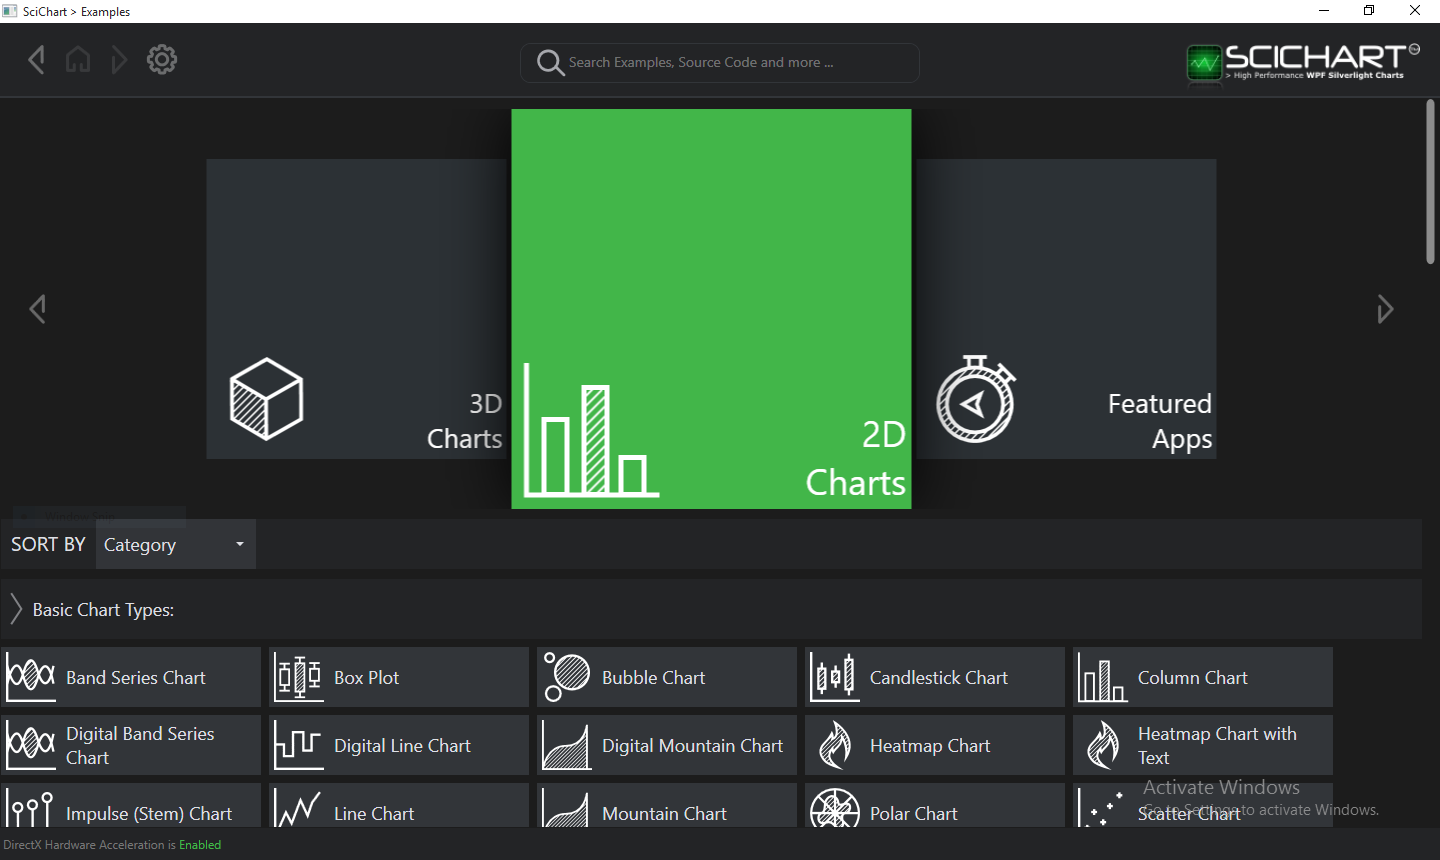
New WPF Examples Suite
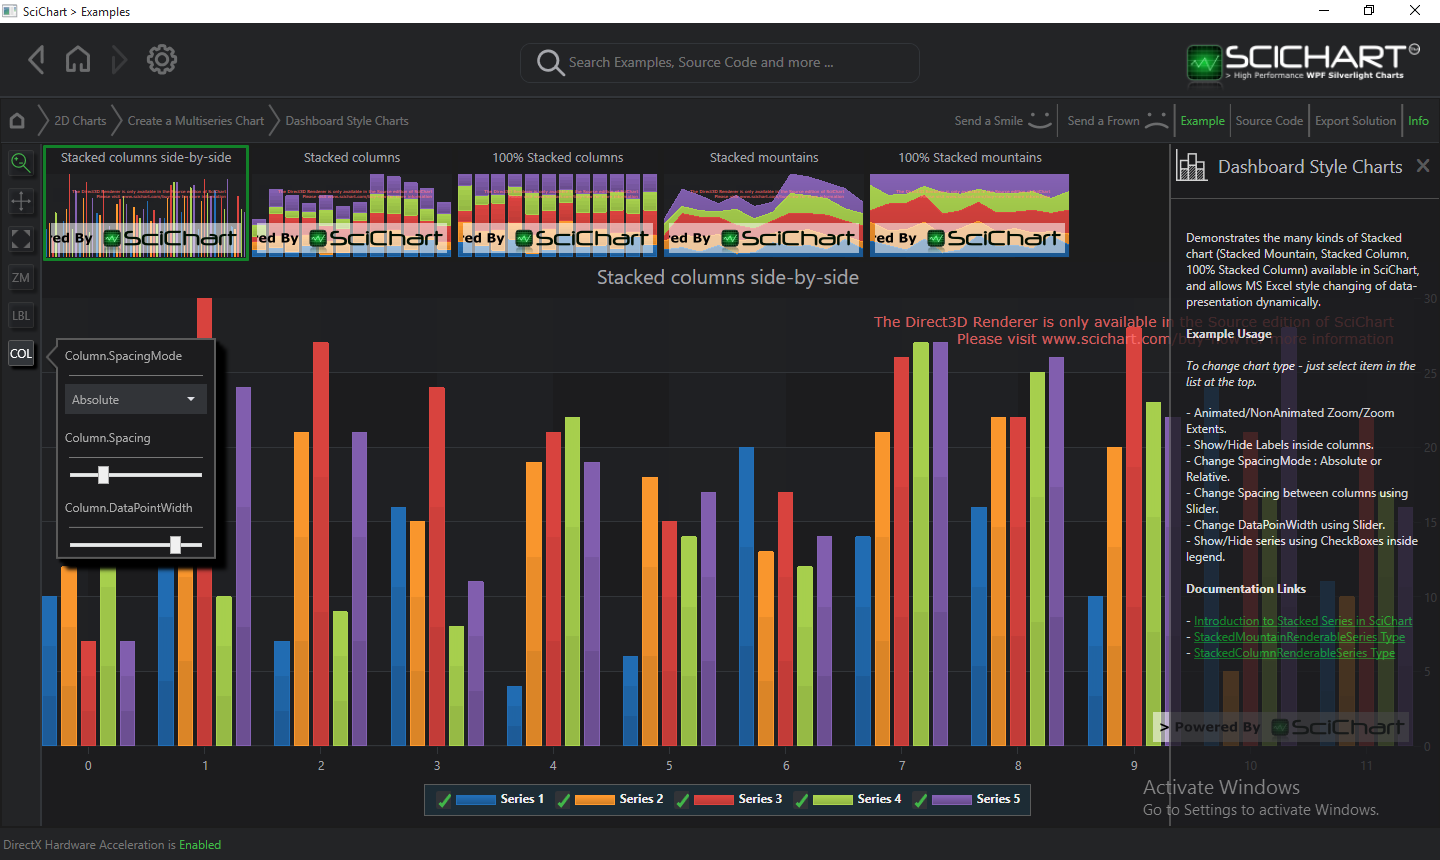
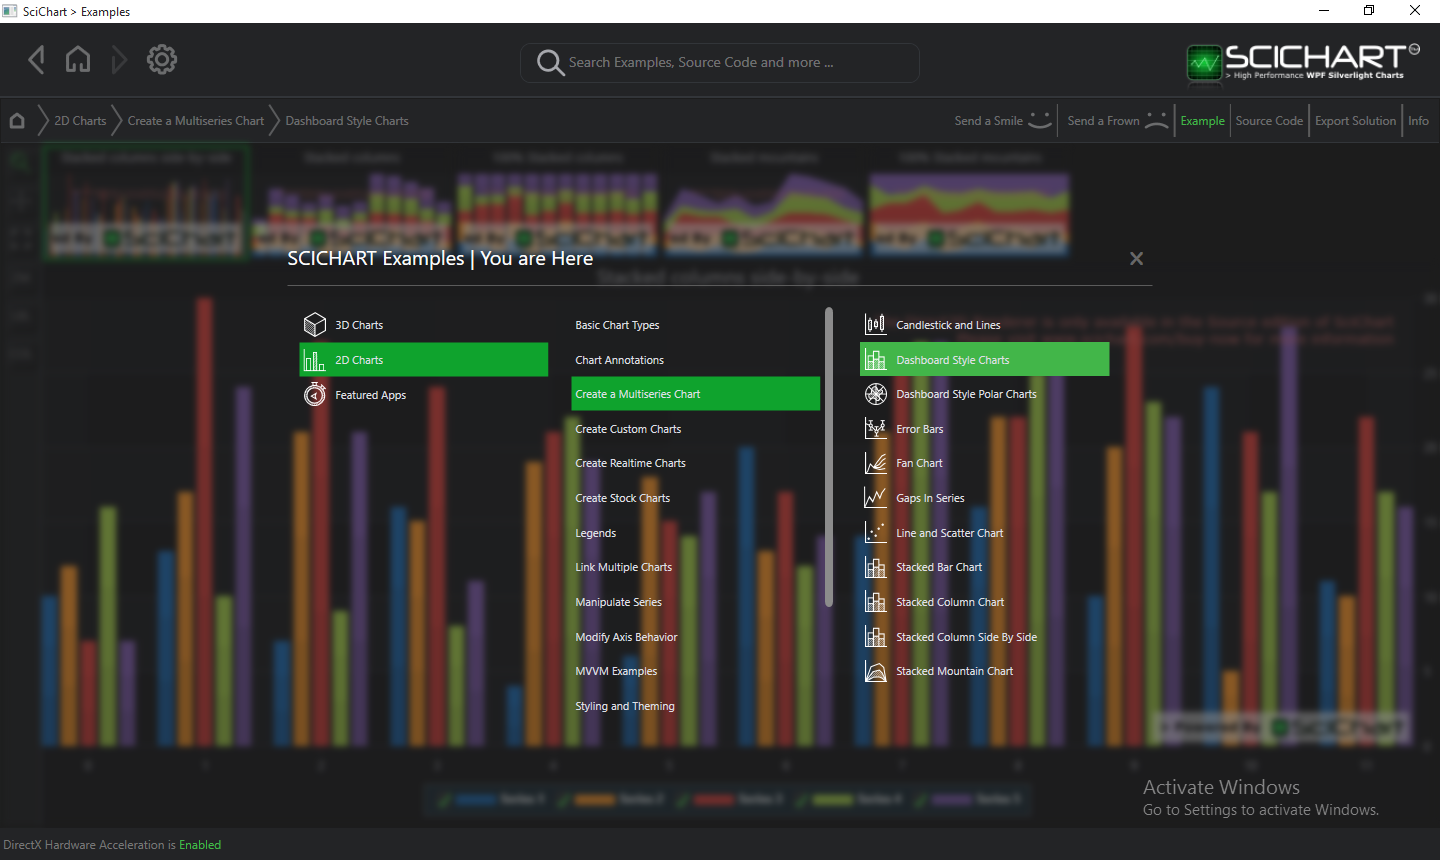
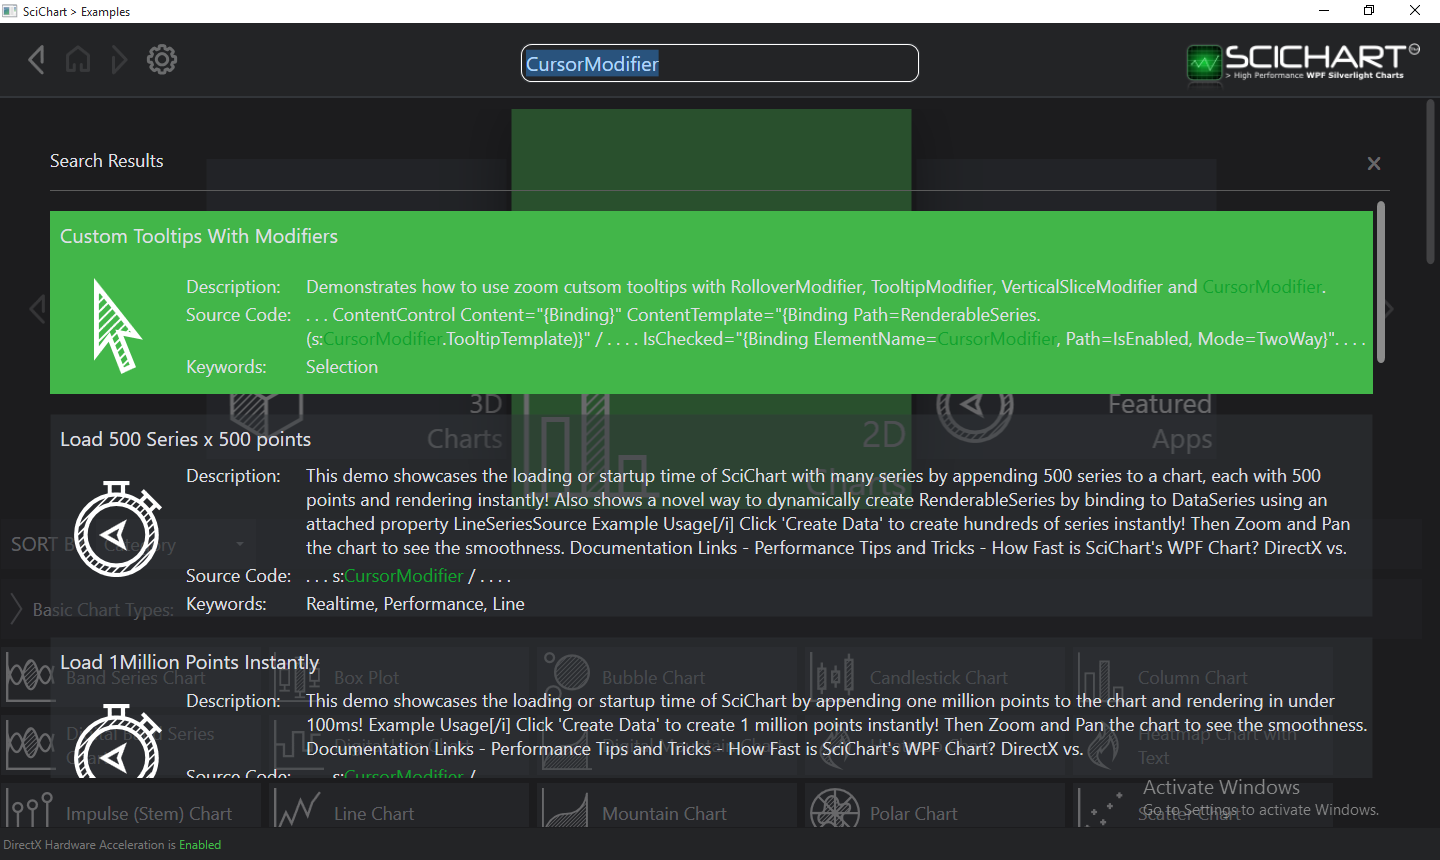
We have developed a new WPF Examples suite, which has a number of enhancements to allow you to work more efficiently and find what you need. Enhancements include:
Ability to full-text search examples by title, source code, help text. e.g. typing ‘CursorModifier’ will show a list of examples which include the CursorModifier
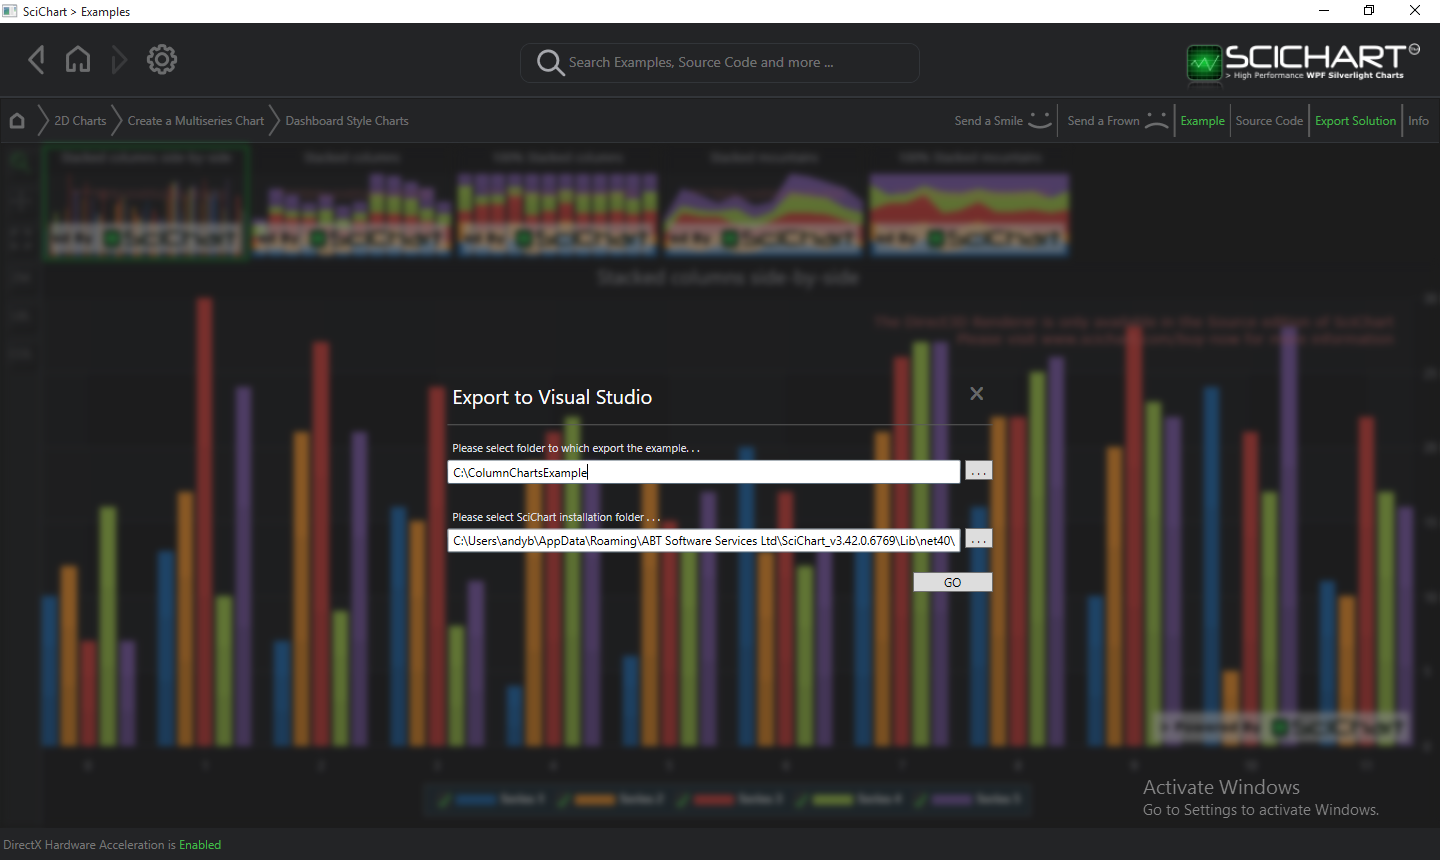
Ability to view source-code in the examples app and also one-click export a single example to stand-alone compilable Visual Studio project. This solves the long-standing problem of how to create or modify our examples.
Help text with hyperlinks to our documentation in the Info pane of each example
A selection of new 2D demos as well as 3D Chart demos
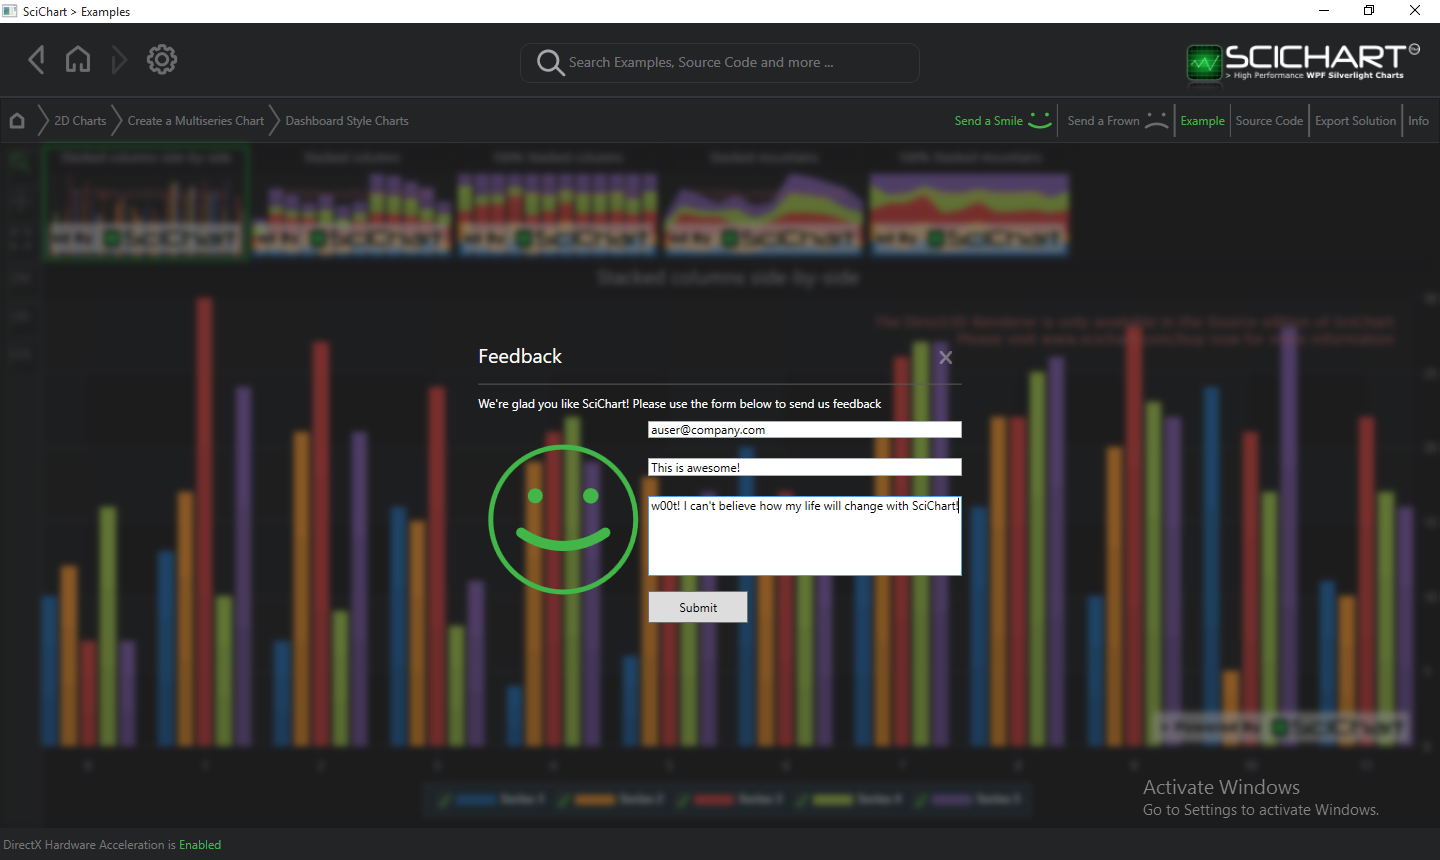
Ability to send feedback (Smile/Frown) directly within the examples app
A slick new style!
Also, following our survey on whether we should be supporting Silverlight, we propose that we drop Silverlight support in v4 (but maintain bug-fixes in Silverlight for v3) and implement a one-click installer for SciChart WPF Examples. We are looking at ways of making the SciChart demo experience as seamless as possible, but with browsers dropping support for Silverlight, we have no choice but to move on from our online Silverlight demo format from the next major version onwards.
Platform Ports in the next 6 months
SciChart Android
We have already begun to port SciChart to Android, and have very encouraging results. We have an Android customer who is part-sponsoring the work for use on custom medical hardware. Our aim is to produce a fully capable port of SciChart 2D WPF on Android by the end of the year.
Utilizing OpenGL rendering and C++ with a Java API the SciChart Android component will be performant, and able to render millions of points on an Android tablet or Android phone. If you are interested in SciChart Android, please get in touch.
Uncertain Platform Ports in the next 6-12 months
SciChart iOS
We have begun to port SciChart to iOS. This port is very early days (only a few months of development) so we anticipate it will be Q1/Q2 2016 before it is released. Early feasibility suggests the port will be performant and we will be able to achieve millions of points of rendering on an iPad or iPhone.
We do not have any customers or interested parties on SciChart iOS yet, so if you are interested and wish to register your interest in SciChart iOS,please get in touch.
SciChart Universal Windows Platform (UWP) 10
Earlier this year we investigated porting to WinRT 8.1 and put this on hold due to deficiencies in the API. Some key parts of the API that we need are missing, such as:
Ability to offscreen render to bitmap (RenderTargetBitmap) used by point-markers (scatter, line charts, impulse series, point-markers, bubble-series) and gradient fills in column, mountain and candlestick charts.
DependencyObject.SetCurrentValue() API is missing. This API function resolves a complex issue in means certain binding operations won’t work with SciChart
MarkupExtensions are missing, used by the SciChart themes, this is not critical but allows for easy dynamic themeing of SciChart components.
DirectX support will be device dependent, for instance, many devices running Windows 10 IoT will only support DirectX in emulated mode.
What we plan to do is skip WinRT 8.1 and investigate directly Universal Windows Platform 10, however, the API does not look much better in this platform, so the time & cost of porting to UWP looks quite high, and the result might be feature limited compared to WPF.
We need to know from our user-base who is seriously considering developing for UWP10 (i.e. is prepared to purchase or renew SciChart Licenses based on commitment to UWP) as Windows RT was a flop and we don’t want to invest on a platform that won’t be loved and appreciated by our userbase!
If we get enough commitment we will divert resources to the platform, so if you are seriously interested in IoT, please let us know.
Pricing
We are reviewing our pricing and product tiers for the release of SciChart v4. What we want to do is continue to be very competitively priced, while opening up the market to more people and having a few different product tiers.
Everyone who is an existing customer in support subscription will be upgraded to SciChart v4 for free.
It is likely that SciChart 3D will be sold separately as a stand alone product, and as a bundle (2D+3D) pricing to be decided.
Conclusion
WPF will continue to be a solid core to our business over the next few years and we see this platform strengthening, not weakening as it remains the defacto standard for enterprise software development on Windows.
We are investigating platform ports such as Android, iOS and UWP and need to hear your feedback about your planned projects. We need real interest & commitment to UWP to divert resources from WPF project(s) where we have a solid and growing business.
We are committed to supporting our existing users on SciChart v3.x, we call this “Business as Usual” and we have almost a thousand active developers in support-subscription to look serve and unknown (possibly tens of thousands) of end-users using software which includes SciChart, so we are committed to quality and rapid response on the support side!
It is our aim to become the de-facto standard for graphics and visualisation on multiple platforms. To do that, we need your help, your continued investment and feedback about how you are using SciChart, what you want to see from it etc…
Is there anything else?
Is there anything else you want to see from us? Let us know! 🙂
CEO / Founder of SciChart.
Masters (MEng) and PhD in Electronics & Signal Processing.Follow me on LinkedIn for more SciChart content, or twitter at @drandrewbt.
Queens Award for Innovation Proud winners of the Queens Award for Innovation, 2019. Awarded on account of our innovative graphics engine which underpins the SciChart library and enables our world-beating charting performance
National Business Awards Highly Commended for Lloyds National Business Awards, 2019. Awarded on account of our innovative graphics engine and impressive customer base
Reviews SciChart has received hundreds of verified, 3rd party reviews
Try SciChart Today
Start a trial and discover why we are the choice of demanding developers worldwide
We use cookies to give you the best experience on our website. Cookies are files stored in your browser and are used by most websites to help personalise your web experience. By continuing to use our website, you are agreeing to our use of cookies.